- Title
-
Myosin Vb Mediated Plasma Membrane Homeostasis Regulates Peridermal Cell Size and Maintains Tissue Homeostasis in the Zebrafish Epidermis
- Authors
- Sonal, ., Sidhaye, J., Phatak, M., Banerjee, S., Mulay, A., Deshpande, O., Bhide, S., Jacob, T., Gehring, I., Nuesslein-Volhard, C., Sonawane, M.
- Source
- Full text @ PLoS Genet.
|
The gsp locus encodes for molecular motor Myosin Vb. Representative images of 48hpf wild-type (A,C) and gsp mutant larvae (B,D). ZO1 immuno-localisation indicates that as compared to wild type (E) cell shapes are irregular and peridermal cells are smaller in the gsp mutant (F). SEM images of wild-type (G) and gsp mutant (H) confirm the rounding-up phenotype of peridermal cells. Sequence chromatograms of gspNS042, gspAT021 and gspNG061 alleles (I). The asterisks in ?I? indicate the base substitutions in the mutant alleles. In situ hybridisation using antisense (J) and sense (K) probes against myoVb. High magnification image (L) reveal that myoVb is expressed in the head peridermal cells. A schematic (M) of domain structure of Myosin Vb indicating the positions of mutations in the three alleles. Note that in NG061 allele the splice site mutation is at 451st aa but the truncation would occur at 475th aa due to a frame-shift. Scale bars in G, H corresponds to 15 µ. |
|
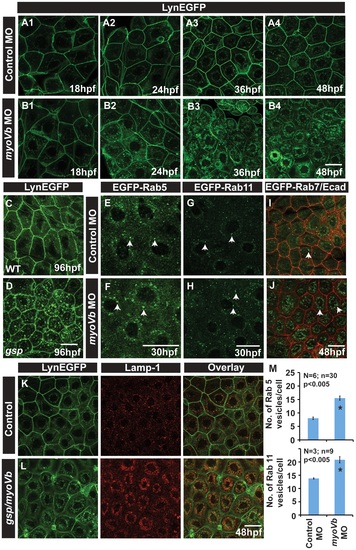
In absence of Myosin Vb, endosomes and lysosomes accumulate in the cytoplasm of peridermal cells. Time course analysis of vesicle accumulation in control (A1-A4) and myoVb (B1-B4) morpholino injected embryos using Tg(cldnB:lynEGFP) background. Note that the accumulation of vesicles begins at 24hpf. In comparison to wild-type (WT) larva (C) gsp mutant (D) exhibit vesicles in the peridermal cells at 4dpf. Analysis of EGFP-Rab 5 (E,F), EGFP-Rab 11 (G,H), EGFP-Rab7 (I,J) vesicle accumulation at 30 hpf in control morpholino (E,G,I) and myoVb morpholino (F,H,J) injected embryos. Note the increase in EGFP-Rab5, EGFP-Rab11 and EGFP-Rab7 labelled endosomes in morphants (F,H,J). Lamp-1 staining in control (K) and gsp/myoVb mutant (L) embryos using Tg(cldnB:lynEGFP) background reveals increased lysosomal activity in mutants (L). Quantification of Rab5 and Rab11 vesicles in control and myoVb morpholino injected embryos at 30 hpf (M). Arrowheads in E,F indicate EGFP-Rab5 labelled early endosomes; in G,H, EGFP-Rab11 labelled recycling endosomes and in I,J, EGFP-Rab7 labelled late endosomes. Asterisk in ?M? indicate that the difference between control and myoVb morpholino injected embryos is statistically significant as per student′s t test (p≤0.05). Scale bars correspond to 20 µ. EXPRESSION / LABELING:
|
|
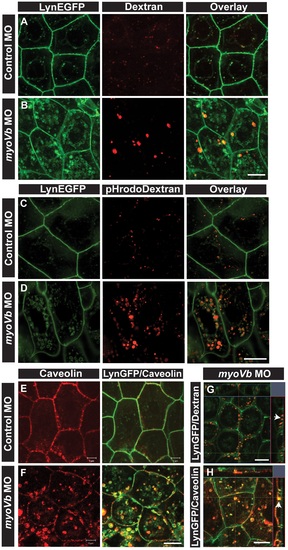
Endocytosis from apical and basolateral domain contributes to endosome and lysosome formation. Uptake of Alexa 546 conjugated Dextran (A,B) and pHrodo Dextran (C,D) by peridermal cells in control (A,C) and myoVb (B,D) morpholino injected embryos obtained from Tg(cldnB:lynEGFP) line. Alexa 546 Dextran and pHrodo Dextran accumulates in lynEGFP vesicles in the morphants. Caveolin staining in lynEGFP expressing peridermal cells of control (E) and myoVb morphants (F) reveal that endocytosis from basolateral domain contributes for vesicle formation in morphants. X-Y plane and orthogonal projections of Alexa 546 Dextran, lynEGFP (G) and caveolin, lynEGFP (H) labelled morphant peridermal cells. Note the apical localisation of Dextran vesicles (arrowhead in G) and basolateral localization of caveolin vesicle (arrowhead in H). Scale bars are equivalent to 10 µ. EXPRESSION / LABELING:
|
|
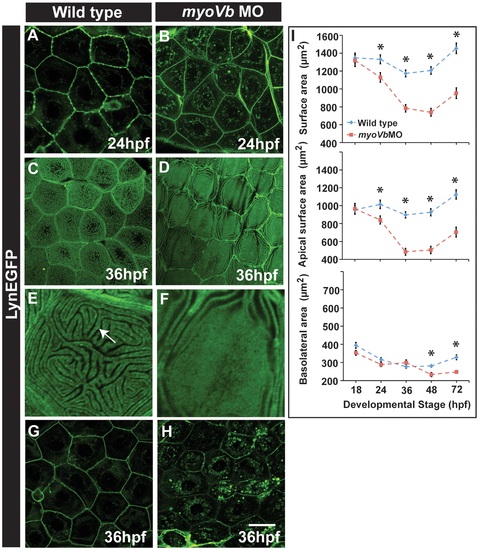
Effect of loss of myosin Vb function on membrane projections, cell size and cell surface area. LynEGFP staining in Tg(cldnB:lynEGFP) background revealed that membrane projections, which exist on basolateral side in wild type peridermal cells at 24hpf (A) are absent in myoVb morphants (B). Furthermore, apical microridges, present in wild type peridermal cells (C), are absent in myosin Vb morphants (D). E, F are digitally zoomed images of cells in ?C? and ?D?, respectively. As compared to wild-type peridermal cells (G), morphant cells are smaller in size (H) at 36hpf. Quantification of cell surface area (I) reveals that total and apical surface area decreases substantially in morphants as compared to wild-type peridermal cells. The decrease in basolateral surface area is evident only after 48hpf. The error bars in ?I? represent standard errors of the mean whereas asterisks in ?I? indicate that the means are significantly different (student′s t test p≤0.05). Arrow indicates an apical microridge in a peridermal cell. Scale bars correspond to 20 µ in A-D and G,H. EXPRESSION / LABELING:
PHENOTYPE:
|
|
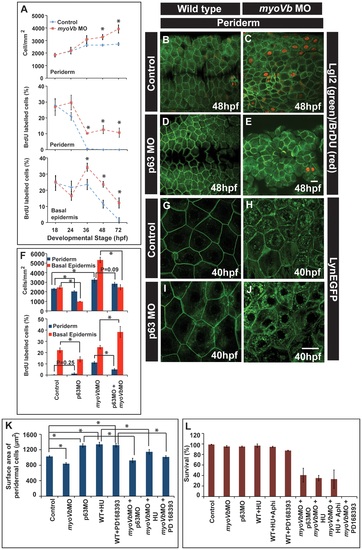
Two-way compensatory mechanism in zebrafish embryonic epidermis. Estimation of peridermal cell density and proliferation index in periderm and basal epidermis using BrdU labelling (A). Note the increase in number of peridermal cells per unit area, which is consistent with increase in the proliferation in the peridermal and basal epidermal cells beyond 24 and 36hpf, respectively. Lgl2 and BrdU labelling of the peridermal cells at 48hpf in wild type (B), myoVb morphant (C), p63 morphant (D) and p63,myoVb double morphant (E). Quantification (F) of cell densities and proliferation indices by BrdU labelling in periderm and basal epidermis under genetic conditions represented in B-to-E. The lynEGFP staining revealed that as compared to wild type (G) the cells are smaller in myoVb (H) and larger in p63 (I) morphants and comparable in p63,myoVb double morphants (J). Quantification of total surface area of a peridermal cell (K) at 40 hpf (for p63), 48 hpf (for PD 168393) and 50hpf (for HU) and percent survival (L) at 48hpf (for p63 and HU+Aphi), 58 hpf (for PD 168393), 74hpf (for HU) under various genetic conditions and treatments mentioned along the X-axis. Since control and myoVbMO conditions repeated in every treatment mentioned in (K), the data for these two was pooled to estimate the average. The square brackets indicate the comparison whereas asterisk indicates that the differences are statistically significant (students t test, p<0.05). The error bars represent the standard error of the mean. Scale bars in E and J correspond to 20 µ in B-E and G-J, respectively. |
|
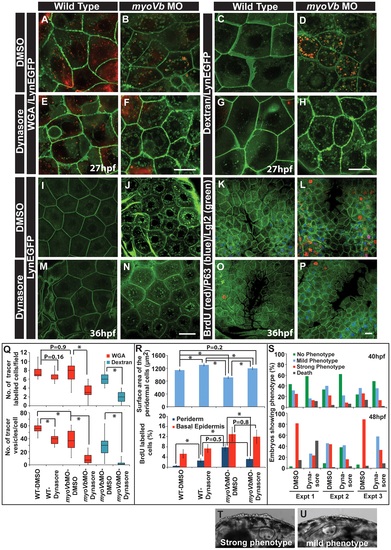
Reduction in endocytosis mitigates the cellular and morphological phenotype in Myosin Vb deficient embryos. Endocytosis of tracers WGA (A,B,E,F) and Dextran (C,D,G,H) in wild type (A,E, C,G) and myoVb morphant embryos (B,F,D,H) treated with DMSO (A,B,C,D) and dynasore (E,F,G,H) in the LynEGFP background. The dynasore treatment decreases endocytosis of both WGA and Dextran. Note that in wild type larvae there is hardly any dextran uptake indicating low rate of fluid phase endocytosis. As compared to wild type, WGA uptake appears less in the morphant. The reason being that the mucous layer is reduced in the mutants. The LynEGFP staining (I,J,M,N) in wild type (I,M) and myosin Vb morphants (J,N) treated with DMSO (I,J) and dynasore (M,N). Cell proliferation analysis using BrdU incorporation (K,L,O,P) in wild type (K,O) and myoVb morphant (L,P) treated with DMSO (K,L) and dynasore (O,P) in LynEGFP background. Note the decrease in proliferation in the morphant periderm upon dynasore treatment. Quantification of WGA and Dextran (Q) uptake by peridermal cells in different genetic backgrounds and under different treatments mentioned along the X axis. The first graph shows the number of cells per field showing uptake of the tracers. The second graph represents the number of vesicles per cell. For this analysis only the cells showing tracer uptake were considered. Quantification of area and cell proliferation for genetic backgrounds and various treatments shown along the X-axis (R). Quantification of embryos showing various degrees of phenotypic strengths (S) at 40 hpf (first graph) and 48 hpf (second graph). The morphant embryos were categorised in three phenotypic classes- strong, mild and no phenotype- based on the head periderm phenotype. The embryos classified as ?no phenotypes? exhibited the decreased fin expansion and occasionally a few rounded up cells in the finfold. Bright field images showing strong (T) and mild (U) phenotypes. Scale bar in F, H corresponds to 10 µ in A,B,E,F and C,D,G,H, respectively whereas scale bars in N,P corresponds to 20 µ in I,J,M,N and K,L,O,P, respectively. Square brakets and associated aseterisks in Q and R represent the comparison by T-test and significant difference (P≤0.05), respectively. |


