
Fig. 6
- ID
- ZDB-IMAGE-160810-25
- Publication
- Sonal et al., 2014 - Myosin Vb Mediated Plasma Membrane Homeostasis Regulates Peridermal Cell Size and Maintains Tissue Homeostasis in the Zebrafish Epidermis
- All Figures
- Figures for Sonal et al., 2014
|
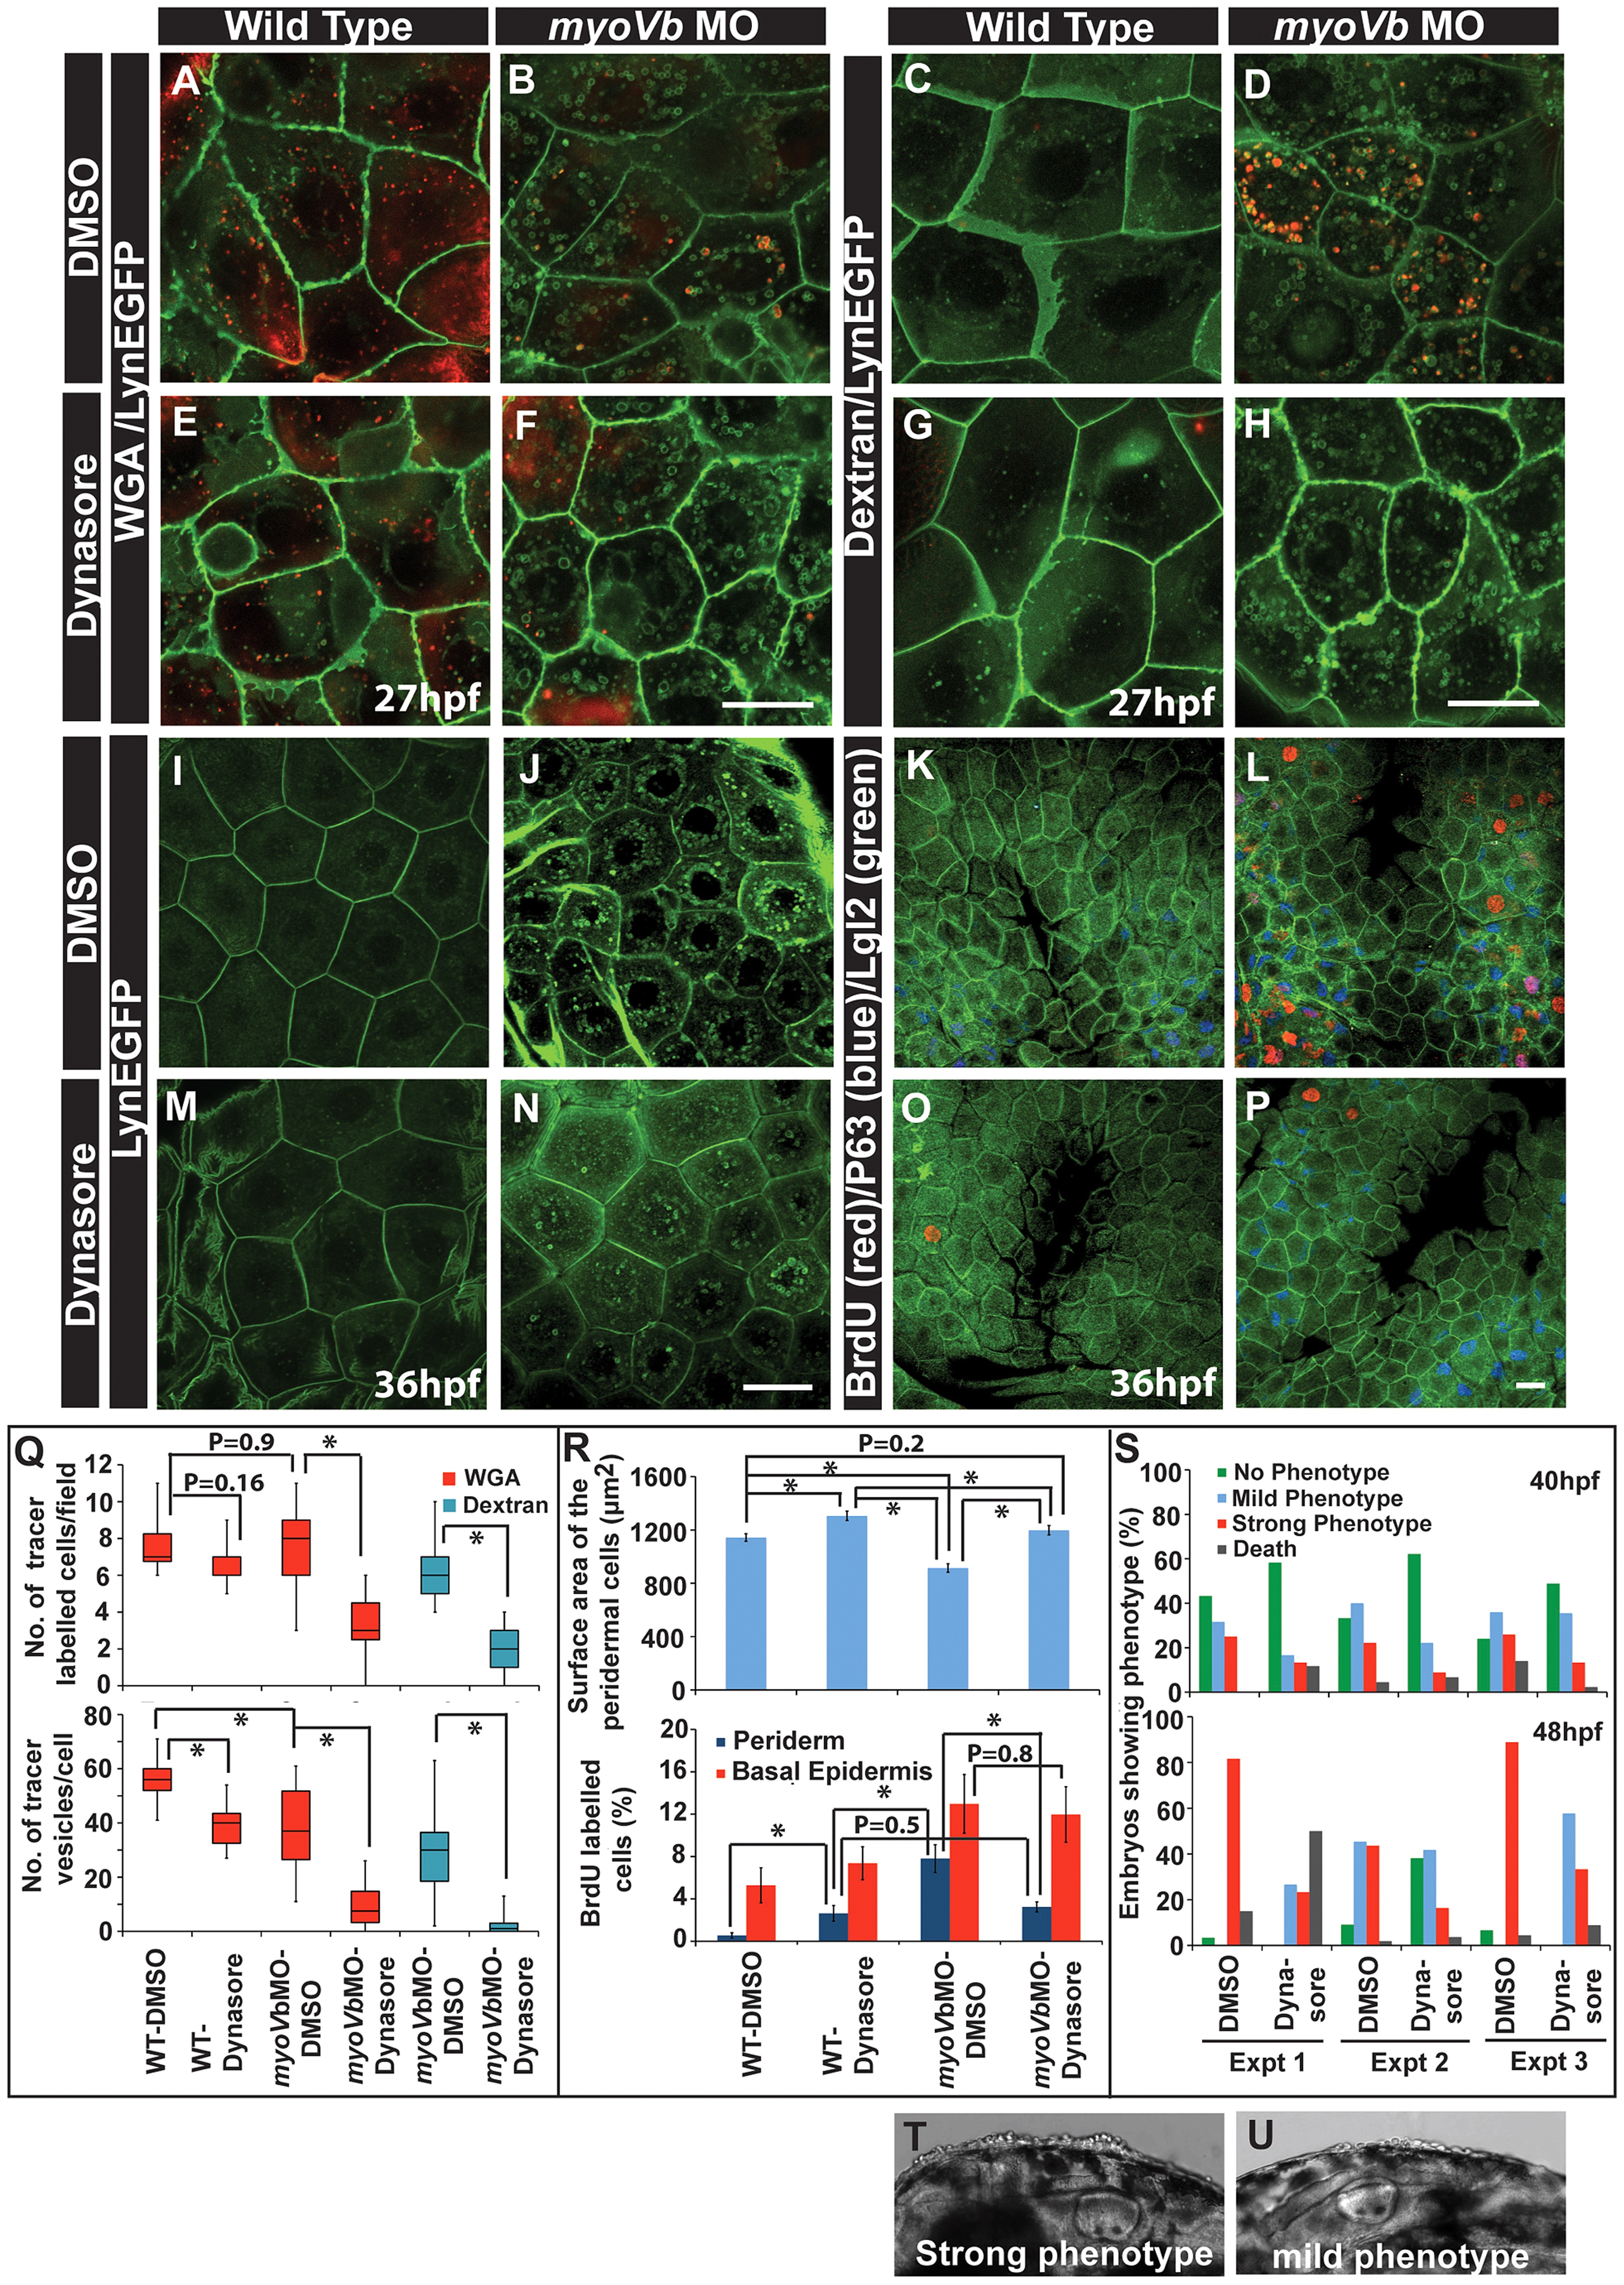
Fig. 6
Reduction in endocytosis mitigates the cellular and morphological phenotype in Myosin Vb deficient embryos.
Endocytosis of tracers WGA (A,B,E,F) and Dextran (C,D,G,H) in wild type (A,E, C,G) and myoVb morphant embryos (B,F,D,H) treated with DMSO (A,B,C,D) and dynasore (E,F,G,H) in the LynEGFP background. The dynasore treatment decreases endocytosis of both WGA and Dextran. Note that in wild type larvae there is hardly any dextran uptake indicating low rate of fluid phase endocytosis. As compared to wild type, WGA uptake appears less in the morphant. The reason being that the mucous layer is reduced in the mutants. The LynEGFP staining (I,J,M,N) in wild type (I,M) and myosin Vb morphants (J,N) treated with DMSO (I,J) and dynasore (M,N). Cell proliferation analysis using BrdU incorporation (K,L,O,P) in wild type (K,O) and myoVb morphant (L,P) treated with DMSO (K,L) and dynasore (O,P) in LynEGFP background. Note the decrease in proliferation in the morphant periderm upon dynasore treatment. Quantification of WGA and Dextran (Q) uptake by peridermal cells in different genetic backgrounds and under different treatments mentioned along the X axis. The first graph shows the number of cells per field showing uptake of the tracers. The second graph represents the number of vesicles per cell. For this analysis only the cells showing tracer uptake were considered. Quantification of area and cell proliferation for genetic backgrounds and various treatments shown along the X-axis (R). Quantification of embryos showing various degrees of phenotypic strengths (S) at 40 hpf (first graph) and 48 hpf (second graph). The morphant embryos were categorised in three phenotypic classes- strong, mild and no phenotype- based on the head periderm phenotype. The embryos classified as “no phenotypes” exhibited the decreased fin expansion and occasionally a few rounded up cells in the finfold. Bright field images showing strong (T) and mild (U) phenotypes. Scale bar in F, H corresponds to 10 µ in A,B,E,F and C,D,G,H, respectively whereas scale bars in N,P corresponds to 20 µ in I,J,M,N and K,L,O,P, respectively. Square brakets and associated aseterisks in Q and R represent the comparison by T-test and significant difference (P≤0.05), respectively.