
IMAGE
Fig. 2
- ID
- ZDB-IMAGE-161020-40
- Genes
- Publication
- Lam et al., 2011 - Molecular conservation of estrogen-response associated with cell cycle regulation, hormonal carcinogenesis and cancer in zebrafish and human cancer cell lines
- All Figures
- Figures for Lam et al., 2011
Image
|
Figure Caption
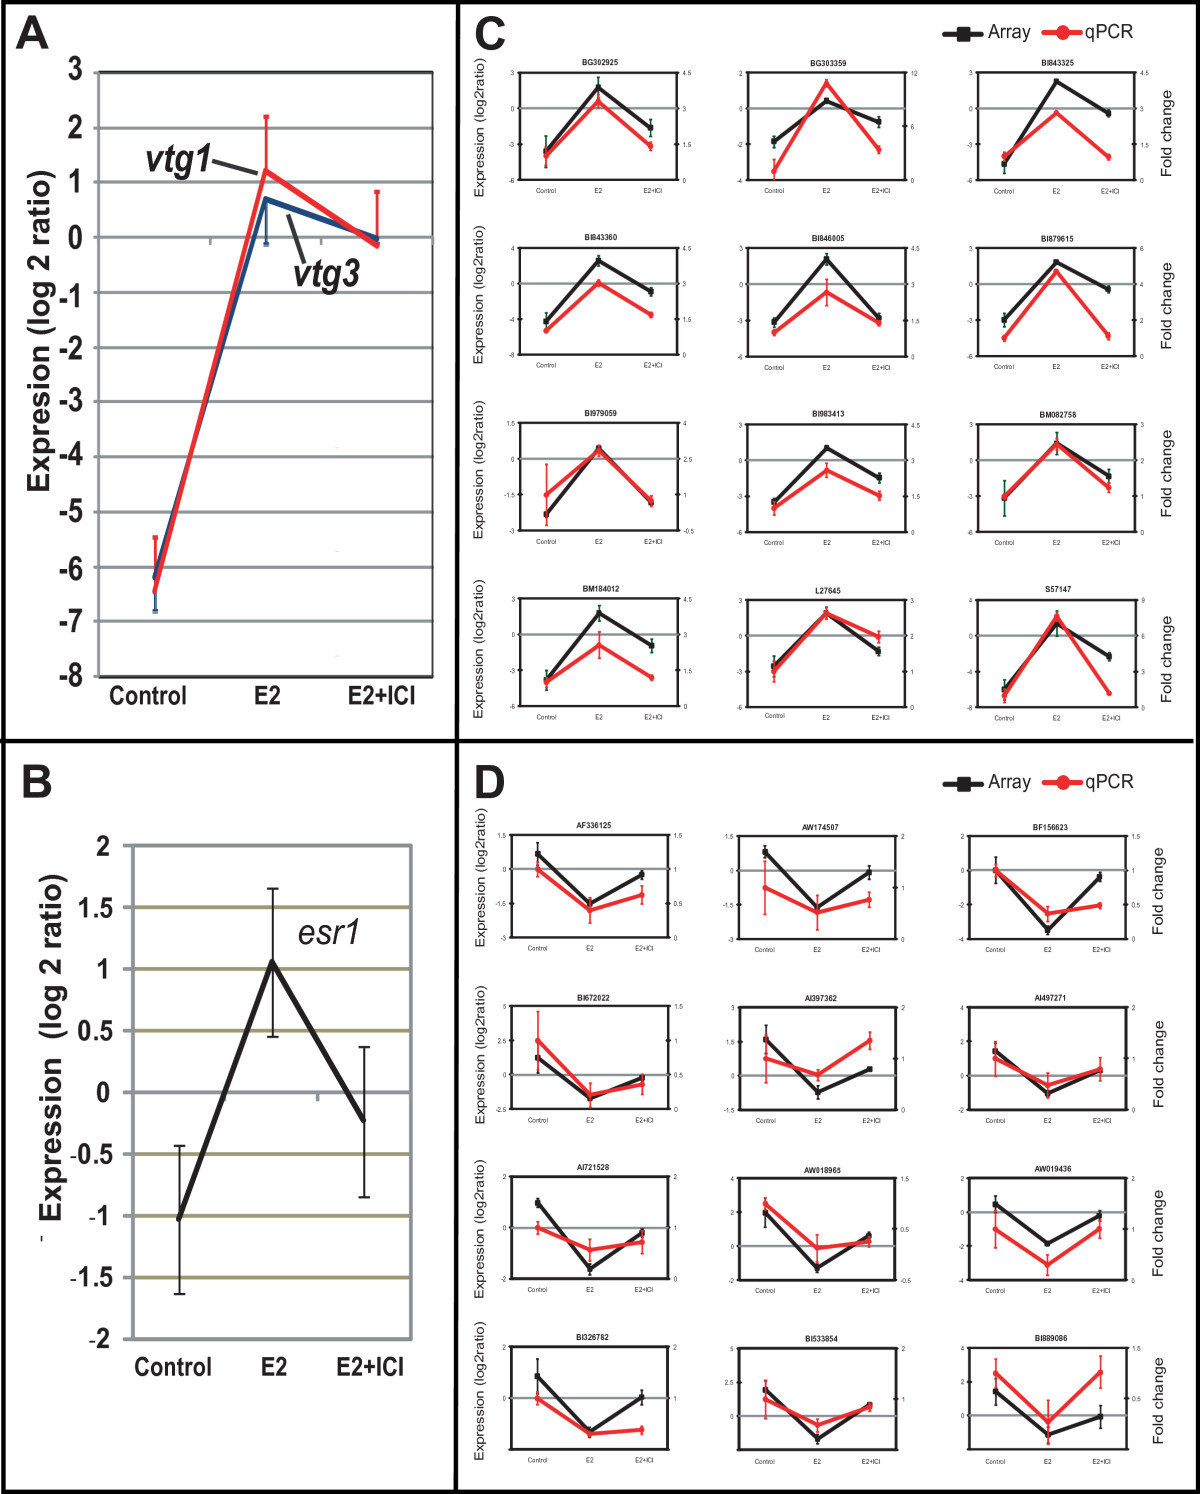
Fig. 2
Validation of microarray data by qRT-PCR. A. Expression levels of vtg1 and vtg3 and B. esr1. C. Selection of representative up-regulated genes. D. Selection of representative down-regulated genes. The data represents average of 3 replicates and presented as mean and standard deviation.
Figure Data
Acknowledgments
This image is the copyrighted work of the attributed author or publisher, and
ZFIN has permission only to display this image to its users.
Additional permissions should be obtained from the applicable author or publisher of the image.
Full text @ BMC Med. Genomics