|
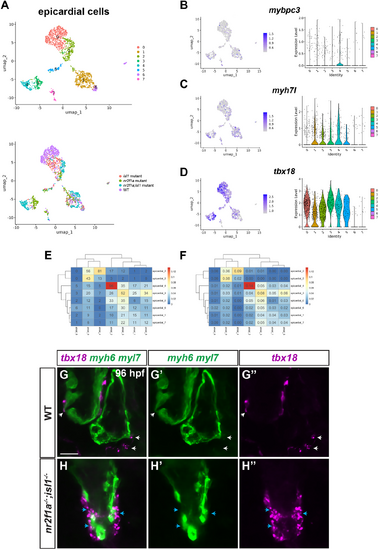
nr2f1a;isl1 mutant atrial cardiomyocytes and epicardial cells share gene expression. (A) UMAPs showing the subclusters (top) and the conditions (bottom) of the cells from the epicardial cells (ECs). (B-D) UMAPs (left) and violin plots (right) of the EC subclusters displaying expression of mybpc3, myh7l and tbx18 in the atrial cardiomyocytes (ACs). (E,F) Number of enriched marker genes that are overlapping and Jaccard similarity scores in the subclusters of ACs and ECs. (G-H″) Optical sections of hybridization chain reaction (HCR) in situ for tbx18, myl7 and myh6 in wild-type sibling and nr2f1a−/−;isl1−/− embryos at 96 hpf. (G-G″) tbx18 expression at the venous pole in the proepicardial organ (white arrows). (H-H″) tbx18 expression in the atrial myocardial layer that lacks myh6 expression and adjacent to myh6 expression (blue arrows). Wild type (n=28) and nr2f1a−/−;isl1−/− (n=14). Scale bar: 10 μm.
|