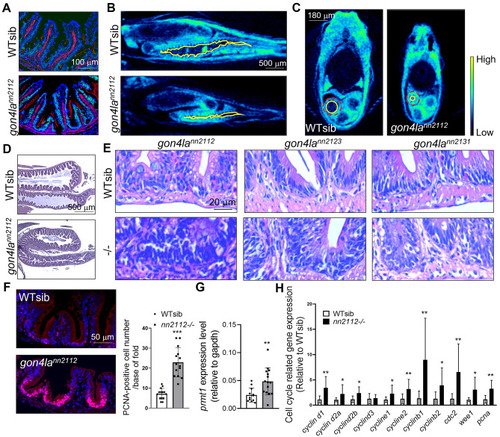
Disrupted protein localization, structural abnormalities, and hyperproliferation in the gon4la mutant intestine. (A) Immunofluorescent staining shows that WT Gon4la (green) is confined to intestinal fold bases; mutant protein is mislocalized towards apical regions. Actin (red), DAPI (blue). μCT images of (B) sagittal sections and (C) transverse sections of whole gut are taken from WT sibling and gon4lann2112 mutant fish at 3–4 mpf. Posterior gut lumen was marked with yellow line. Dashed red line circled the posterior gut (n = 3/group). Relative lumen size of the posterior gut, calculated as the ratio of lumen area (yellow circle) to total transverse-sectional area (dashed red circle): WTsib: 0.375 ± 0.097; gon4lann2112 mutant fish: 0.081 ± 0.060. p = 0.016. (D) H&E staining of gut highlights abnormal fold structures in gon4lann2112 mutant fish. (E) H&E staining of posterior intestine shows densely packed nuclei at the fold bases across all three mutant lines. (F) PCNA immunostaining shows increased proliferating cells at fold bases in gon4lann2112 mutants. Quantified across 14 folds of 3 fish per group. (G) qRT-PCR analysis shows upregulation of the ISC/TA cell marker prmt1 in the intestine of gon4lann2112 mutant fish. n = 12 for WT siblings and n = 15 for gon4lann2112 mutants. gapdh was used as an internal control. (H) The expression of cell cycle-related markers, especially those associated with G2 phase, was significantly upregulated in the gut of gon4lann2112 mutants relative to WT siblings, as determined by qRT-PCR. Data were normalized (relative to gapdh level) and expressed as fold change compared to WT controls (WT, n = 12; mutants, n = 14).
|
