|
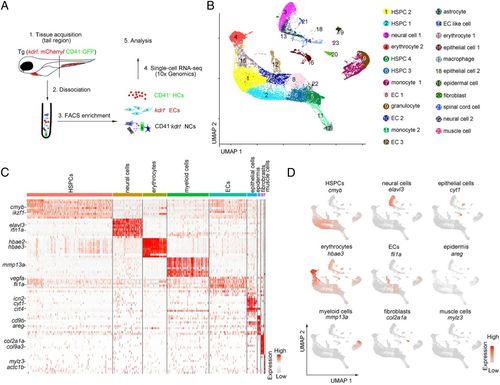
Single-cell transcriptome map of zebrafish CHT. (A) A schematic paradigm of tissue processing and fluorescence-activated cell sorting for scRNA-seq profiling of CHT. ECs, HCs, and NCs were sorted from Tg (kdrl:mCherry/CD41:GFP) embryos across three developmental stages (55 hpf, 3.5 dpf, and 4.5 dpf). (B) UMAP plot showing 23 CHT cell clusters across three developmental stages (28,777 cells). Cells are colored by their cell-type annotation and numbered according to the legend beside. (C) Heatmap showing blocks of DEGs (top 10 genes) in HSPCs, neural cells, erythrocytes, myeloid cells, ECs, epithelial cells, epidermis, fibroblasts, and muscle cells in the CHT. (D) UMAP visualization of the expression of curated feature genes for cell-type identification.
|