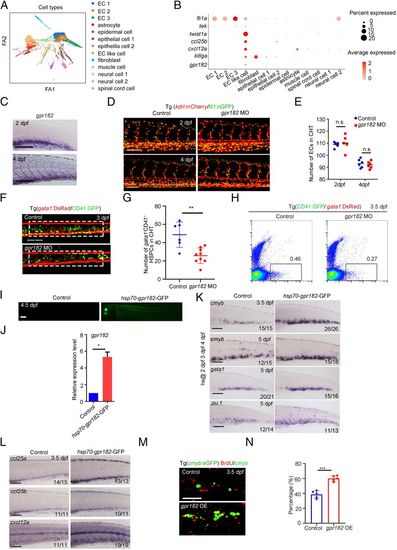
Identification of crucial niche regulator for HSPC expansion. (A) ForceAtlas2 plot of nonhematopoietic niche cells (10,200 cells). Cells are colored by their cell-type annotation. (B) Dot plot showing the expression of selected known EC, muscle cell, and epithelial cell genes (fli1a, tek, twist1a, ccl25b, cxcl12a, kitlga, and gpr182) for niche cell clusters. (C) WISH showing the expression of gpr182 in CHT at 2 dpf and 4 dpf. (D) Confocal imaging of the Tg (kdrl:mCherry/fli1:nGFP) showing the structure of ECs in the CHT region at 2 dpf and 4 dpf in control and gpr182 morphants. (Scale bar, 50 mm.) (E) The statistical data of the CHT-EC number in control and morphants at 2 dpf and 4 dpf. The dashed boxes indicate the region of EC counting. (F) Confocal imaging of the Tg (CD41:GFP/gata1:DsRed) showing the number of CD41 +gata1− HSPCs in the CHT region at 3 dpf in control and gpr182 morphants. (Scale bar, 50 mm.) (G) The statistical data of the CHT CD41 +gata1− HSPC number in F. The dashed boxes indicate the region of CD41+gata1− HSPC counting. (H) Fluorescence-activated cell sorting analysis showing the number of CD41+ gata1− HSPCs in control and gpr182 morphants at 3.5 dpf. (I) The imaging of GFP fluorescence in Tg (hsp70-gpr182-GFP) embryos at 4.5 dpf. Heat shock was performed at 2 dpf, 3 dpf, and 4 dpf. (J) qPCR result of gpr182 expression in control and hsp70-gpr182-GFP-positive embryos. (K) WISH showing the expression of cmyb, gata1, and pu.1 in the CHT of the control and hsp70-gpr182-GFP-injected embryos at 3.5 dpf and 5 dpf. (L) WISH showing the expression of ccl25a, ccl25b, and cxcl12a in control and gpr182-overexpressed embryos at 3.5 dpf. (M) The double staining imaging of anti-BrdU and anti-GFP antibodies in control and gpr182-overexpressed embryos at 3.5 dpf. OE, overexpression. (N) The statistical data of the percentage of cmyb:GFP+BrdU+/cmyb:GFP+ cells in M. (Scale bar (C, I, L, and M), 100 μm.) The results are represented as means ± SD; *P < 0.05, **P < 0.01, ***P < 0.001; ns, not significant. Student’s t test.
|
