
FIGURE
Fig. 4
- ID
- ZDB-FIG-110722-2
- Publication
- Lupo et al., 2011 - Retinoic acid receptor signaling regulates choroid fissure closure through independent mechanisms in the ventral optic cup and periocular mesenchyme
- Other Figures
- All Figure Page
- Back to All Figure Page
Fig. 4
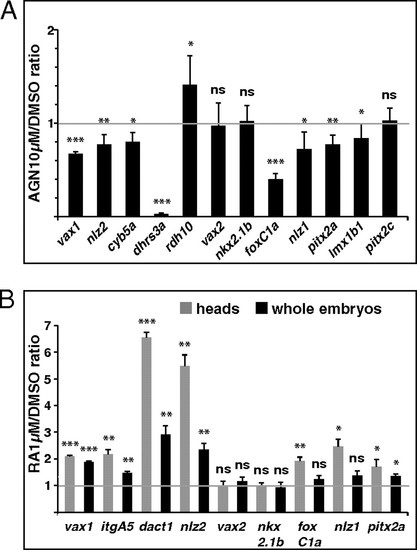
Quantification of gene expression changes after manipulations of RAR signaling. (A and B) Real-time PCR quantification of gene expression in 31- to 33-hpf dissected heads (A) or 25- to 28-hpf dissected heads and whole embryos (B) after treatments with the indicated reagents from 3s, shown as the mean ratio between AGN or RA and DMSO conditions in six (A) or three (B) biological replicates. Error bars show SDs. *P < 0.05; **P < 0.01; ***P < 0.001; ns, nonsignificant (P ≥ 0.05) according to two-tailed Student's t test. |
Expression Data
| Genes: | |
|---|---|
| Fish: | |
| Anatomical Terms: | |
| Stage: | Prim-15 |
Expression Detail
Antibody Labeling
Phenotype Data
Phenotype Detail
Acknowledgments
This image is the copyrighted work of the attributed author or publisher, and
ZFIN has permission only to display this image to its users.
Additional permissions should be obtained from the applicable author or publisher of the image.
Full text @ Proc. Natl. Acad. Sci. USA