
FIGURE
Fig. S1
- ID
- ZDB-FIG-080715-20
- Publication
- Krens et al., 2008 - Distinct functions for ERK1 and ERK2 in cell migration processes during zebrafish gastrulation
- Other Figures
- All Figure Page
- Back to All Figure Page
Fig. S1
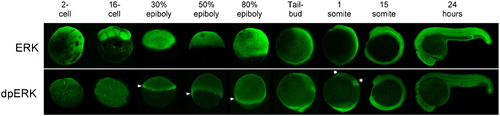
Spatio-temporal distribution of global ERK protein, compared to active dual-phosphorylated ERK (dpERK) protein by immuno-histochemistry. DpERK signal was stronger on the cleavage-sites (2-cell and 16-cell stage). During gastrulation dpERK signal was enhanced in the margin (►). After completion of gastrulation stronger signals were observed in the tailbud, MHB (*) and the anterior neural boundary (●). (5x objective, Biorad confocal laser scanning microscope). |
Expression Data
| Genes: | |
|---|---|
| Fish: | |
| Anatomical Term: | |
| Stage Range: | 2-cell to Prim-5 |
Expression Detail
Antibody Labeling
Phenotype Data
Phenotype Detail
Acknowledgments
This image is the copyrighted work of the attributed author or publisher, and
ZFIN has permission only to display this image to its users.
Additional permissions should be obtained from the applicable author or publisher of the image.
Reprinted from Developmental Biology, 319(2), Krens, S.F., He, S., Lamers, G.E., Meijer, A.H., Bakkers, J., Schmidt, T., Spaink, H.P., and Snaar-Jagalska, B.E., Distinct functions for ERK1 and ERK2 in cell migration processes during zebrafish gastrulation, 370-383, Copyright (2008) with permission from Elsevier. Full text @ Dev. Biol.