
Fig. 3
- ID
- ZDB-FIG-080715-14
- Publication
- Krens et al., 2008 - Distinct functions for ERK1 and ERK2 in cell migration processes during zebrafish gastrulation
- Other Figures
- All Figure Page
- Back to All Figure Page
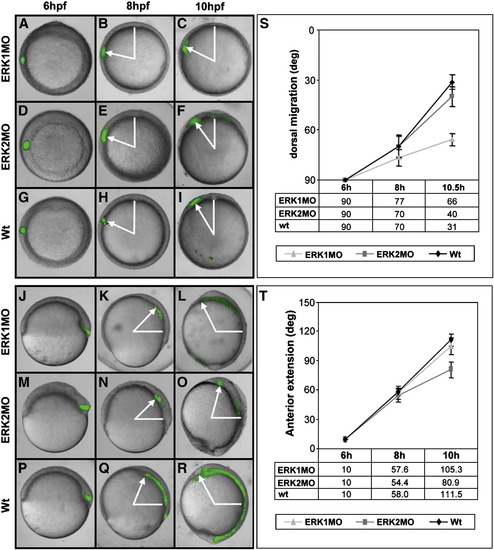
ERK1 and ERK2 are differentially involved in CE cell movements. Embryos were injected with MO and caged fluorescein dextran, which was activated at shield stage (6 hpf) laterally to determine dorsal migration (A–I; animal pole view, dorsal to top) and dorsally to determine anterior extension (J–R; lateral view, dorsal to right). Images show uncaging cells directly after activation (A, D, G, J, M, P), at 8 hpf (B, E, H, K, N, Q) and at 10 hpf (C, F, I, L, O, R). Cell-tracing experiments were performed in ERK1MO injected (A–C, J–L), ERK2MO injected (D–F, M–O) and wild type embryos (G–I, P–R). (S) Quantification of dorsal migration (n = 10), measured as indicated with white arrows (A–I) as degrees from dorsal. (T) Quantification of anterior migration measured as indicated with white arrows (J–R) as degrees of anterior movement (n = 10). ERK1MO: gray triangle, ERK2MO: dark gray square, wild type: black diamond. |
| Fish: | |
|---|---|
| Knockdown Reagents: | |
| Observed In: | |
| Stage Range: | 75%-epiboly to Bud |
Reprinted from Developmental Biology, 319(2), Krens, S.F., He, S., Lamers, G.E., Meijer, A.H., Bakkers, J., Schmidt, T., Spaink, H.P., and Snaar-Jagalska, B.E., Distinct functions for ERK1 and ERK2 in cell migration processes during zebrafish gastrulation, 370-383, Copyright (2008) with permission from Elsevier. Full text @ Dev. Biol.