
Fig. 7
- ID
- ZDB-FIG-080715-18
- Publication
- Krens et al., 2008 - Distinct functions for ERK1 and ERK2 in cell migration processes during zebrafish gastrulation
- Other Figures
- All Figure Page
- Back to All Figure Page
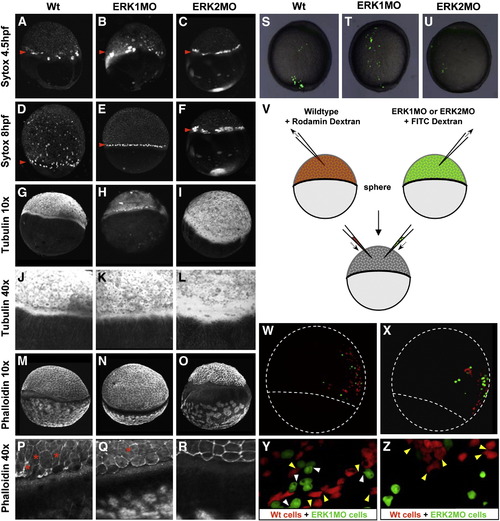
Depletion of active ERK2 affects migration of the YSL, cytoskeleton reorganization and cell shape. (A–F) YSL-migration was followed in vivo by co-injection of 10 mM sytox green at 4.5 hpf (A–C) and 8 hpf (D–F). The animal-to-vegetal migration of the YSN within the YSL is indicated with a red arrowhead. The YSL of ERK2 morphants does not migrate to the vegetal pole in time (C, F) as in wild type embryos (A, D) or ERK1 morphants (B, E; slightly delayed). (G–L) Tubulin cytoskeleton was analyzed by antibody staining (G–I, Zeiss EC Plan-Neofluar 10x/0.30 objective; J–L, Zeiss Plan-Neofluar 40x/0.75 ∞/0.17). Tubulin structures nicely condensate at the vegetal base of the YSL in wild type embryos (G, J) and ERK1 morphants (H, K), but this is perturbed in ERK2 morphants (I, L). (M–R) Actin cytoskeleton was analyzed by Phalloidin staining (M–O, 10x objective; P–R, 40x objective). Local actin recruitment in the YSL is observed in both wild type (M,P) and ERK1 morphants (N, Q), but not in ERK2 morphants (O, R). The red asterisks indicate stretched cells, only observed in wild type and ERK1 morphants. (S, T, U); lateral view, dorsal to right. FITC dextran-labeled wild type, ERK1MO or ERK2MO is transplanted into wild type hosts and grown to complete epiboly. (V); Schematic representation of a double transplantation experiment. Wild type embryos are injected with Rhodamin dextran, morphant embryos are co-injected with FITC dextran. Embryos are grown till sphere stage and cells from both donor embryos are transplanted into the anima pole of a wildtype acceptor embryo and let to develop. (W, X) Overlay of images taken by confocal laser scanning microscopy of co-transplanted wild type (red) and ERK1 or ERK2 morphant cells (green) into wild type hosts at approximately 7 hpf, with enlargements in (S, T). Yellow arrowheads indicate filopodia formation by wild type cells; white arrowheads indicate filopodia formation by morphant cells (only in panel S). Dotted lines in panels W and X indicate epiboly progression and the outline of the embryo. |
Reprinted from Developmental Biology, 319(2), Krens, S.F., He, S., Lamers, G.E., Meijer, A.H., Bakkers, J., Schmidt, T., Spaink, H.P., and Snaar-Jagalska, B.E., Distinct functions for ERK1 and ERK2 in cell migration processes during zebrafish gastrulation, 370-383, Copyright (2008) with permission from Elsevier. Full text @ Dev. Biol.