
Fig. 5
- ID
- ZDB-FIG-080715-16
- Publication
- Krens et al., 2008 - Distinct functions for ERK1 and ERK2 in cell migration processes during zebrafish gastrulation
- Other Figures
- All Figure Page
- Back to All Figure Page
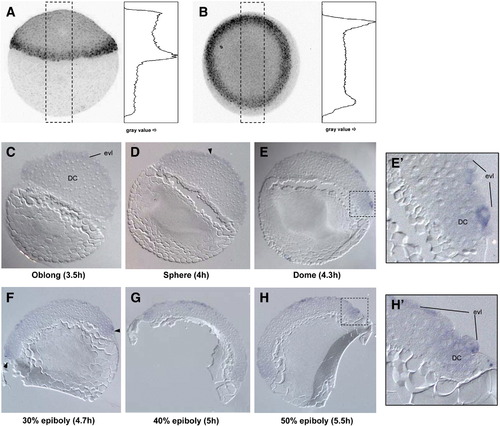
Active ERK is localized in the EVL prior epiboly and detected in EVL and marginal deep cells upon epiboly initiation. Embryos were fixed and subsequently stained for ERK activation by immuno-fluorescence at 30% epiboly (A, lateral view, dorsal to right and panel B, top view, dorsal to top) and quantified by pixel-intensity plots (gray-value in graphs). The phospho-ERK signal was weakly detected in the whole animal pole and stronger in the margin, with the strongest signal in the putative dorsal margin (B). Sectioning of embryos AP-stained for active ERK1/2 at epiboly initiation: oblong, sphere, dome, 30%-, 40%- and 50% epiboly (C–H respectively; lateral view of 8 μm section, images with Zeiss EC Plan-Neofluar 10x/0.30 objective, presumptive dorsal to right), revealed that phospho-ERK is present in the EVL from oblong–sphere stage onwards (C–H). Phospho-ERK was detected in deep cells in the margin from dome stage onwards (E–H, with magnification in panel E′ and H′). Arrowheads indicate initial detection of the signal (EVL in panel D, ventral and dorsal margin in panel F). |
| Genes: | |
|---|---|
| Fish: | |
| Anatomical Terms: | |
| Stage: | Dome |
Reprinted from Developmental Biology, 319(2), Krens, S.F., He, S., Lamers, G.E., Meijer, A.H., Bakkers, J., Schmidt, T., Spaink, H.P., and Snaar-Jagalska, B.E., Distinct functions for ERK1 and ERK2 in cell migration processes during zebrafish gastrulation, 370-383, Copyright (2008) with permission from Elsevier. Full text @ Dev. Biol.