
FIGURE
Fig. 1
- ID
- ZDB-FIG-061215-14
- Publication
- Covassin et al., 2006 - Global analysis of hematopoietic and vascular endothelial gene expression by tissue specific microarray profiling in zebrafish
- Other Figures
- All Figure Page
- Back to All Figure Page
Fig. 1
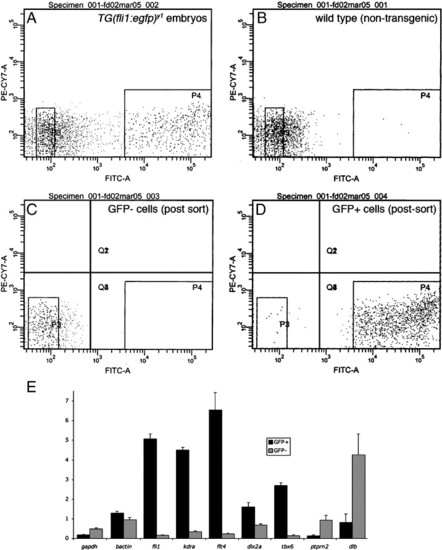
Enrichment of GFP+ cells from Tg(fli1:egfp)y1 zebrafish embryos. (A-D) Diagnostic fluorescence activated cell sorting of dissociated Tg(fli1:egfp)y1 embryos. (A) Cells from Tg(fli1:egfp)y1 embryos. (B) Cells from non-transgenic wild type embryos. (A, B) P3 and P4 demarcate cells sorted as GFP- and GFP+, respectively. (C) GFP- cells following FACS isolation. (D) GFP+ cells following FACS isolation. (E) Relative expression of indicated genes in GFP+ (black bars) and GFP- (gray bars) determined by quantitative RT-PCR. Relative expression levels were determined by normalization to ef1a. |
Expression Data
| Genes: | |
|---|---|
| Fish: | |
| Anatomical Term: | |
| Stage: | Prim-5 |
Expression Detail
Antibody Labeling
Phenotype Data
Phenotype Detail
Acknowledgments
This image is the copyrighted work of the attributed author or publisher, and
ZFIN has permission only to display this image to its users.
Additional permissions should be obtained from the applicable author or publisher of the image.
Reprinted from Developmental Biology, 299(2), Covassin, L., Amigo, J.D., Suzuki, K., Teplyuk, V., Straubhaar, J., and Lawson, N.D., Global analysis of hematopoietic and vascular endothelial gene expression by tissue specific microarray profiling in zebrafish, 551-562, Copyright (2006) with permission from Elsevier. Full text @ Dev. Biol.