
Fig. 7
- ID
- ZDB-FIG-061215-13
- Publication
- Covassin et al., 2006 - Global analysis of hematopoietic and vascular endothelial gene expression by tissue specific microarray profiling in zebrafish
- Other Figures
- All Figure Page
- Back to All Figure Page
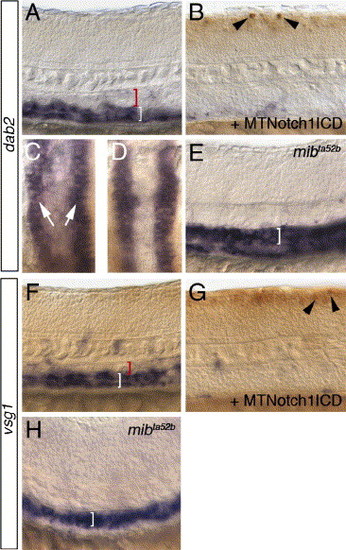
Notch represses dab2 and vsg1 expression. (A–E) dab2 expression. (A) Wild type sibling embryo following heat shock. Red bracket indicates dorsal aorta, white bracket posterior cardinal vein. (B) Tg(hsp70:gal4)kca4;Tg(uas:myc-notch-intra)kca3 embryo following heat shock. Myc-positive cells in the neural tube are indicated by black arrowheads. (C, D) Dorsal view of dab2 expression in pronephric ducts (white arrows). (C) Same embryo as shown in panel A; (D) same embryos as seen in panel B. (E) Ectopic dab2 expression in the dorsal aorta (white bracket) of an mibta52b mutant embryo. (F–H) vsg1 expression. (F) Wild type sibling embryo following heat shock. Red bracket indicates dorsal aorta, white bracket posterior cardinal vein. (G) Tg(hsp70:gal4)kca4;Tg(uas:myc-notch-intra)kca3 embryo following heat shock. Myc-positive cells in the neural tube are indicated by black arrowheads. (H) Ectopic vsg1 expression in the dorsal aorta (white bracket) of an mibta52b mutant embryo. |
| Genes: | |
|---|---|
| Fish: | |
| Anatomical Terms: | |
| Stage: | Prim-5 |
Reprinted from Developmental Biology, 299(2), Covassin, L., Amigo, J.D., Suzuki, K., Teplyuk, V., Straubhaar, J., and Lawson, N.D., Global analysis of hematopoietic and vascular endothelial gene expression by tissue specific microarray profiling in zebrafish, 551-562, Copyright (2006) with permission from Elsevier. Full text @ Dev. Biol.