
FIGURE
Fig. 2
- ID
- ZDB-FIG-061218-10
- Publication
- Covassin et al., 2006 - Global analysis of hematopoietic and vascular endothelial gene expression by tissue specific microarray profiling in zebrafish
- Other Figures
- All Figure Page
- Back to All Figure Page
Fig. 2
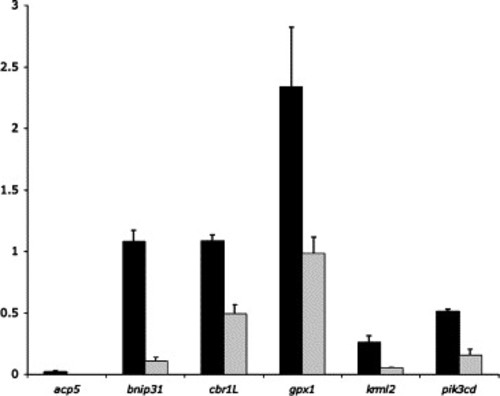
Quantitative RT-PCR analysis of previously described non-fli1+ and ubiquitously expressed genes (see Table 2). qRT-PCR was performed on RNA derived from fli1:egfp+ (black bars) and egfp- (gray bars) cells from 22 to 24 hpf embryos. |
Expression Data
| Genes: | |
|---|---|
| Fish: | |
| Anatomical Term: | |
| Stage: | 26+ somites |
Expression Detail
Antibody Labeling
Phenotype Data
Phenotype Detail
Acknowledgments
This image is the copyrighted work of the attributed author or publisher, and
ZFIN has permission only to display this image to its users.
Additional permissions should be obtained from the applicable author or publisher of the image.
Reprinted from Developmental Biology, 299(2), Covassin, L., Amigo, J.D., Suzuki, K., Teplyuk, V., Straubhaar, J., and Lawson, N.D., Global analysis of hematopoietic and vascular endothelial gene expression by tissue specific microarray profiling in zebrafish, 551-562, Copyright (2006) with permission from Elsevier. Full text @ Dev. Biol.