FIGURE SUMMARY
Title

Migration and differentiation of muscle stem cells are coupled by RhoA signalling during regeneration

Authors
Brondolin, M., Herzog, D., Sultan, S., Warburton, F., Vigilante, A., Knight, R.D.
Source
Full text @ Open Biol.

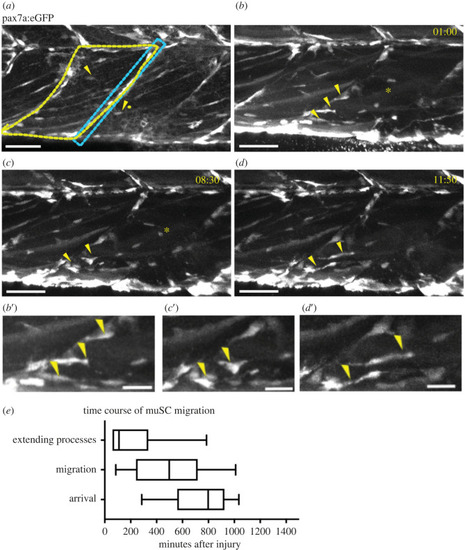
MuSCs show a transition in shape as they move from the myoseptum towards the site of injury (asterisk). GFP + muSCs (arrowheads) in uninjured 7 dpf pax7a:egfp larvae are located at the myoseptum (blue box) or in the myotome (yellow outline, a). In the presence of an injury GFP + muSCs at the vertical borders of the myoseptum extend processes into the myotome (b′, arrowheads) and undergo extensive movement along the myoseptum (b). They then stabilize a process extending into the myotome (c′, arrowheads) and detach from the myoseptum (c). Subsequently the GFP + muSCs migrate towards the site of injury, extending processes in multiple directions (d′, arrowheads) as they migrate (d). Quantification of cell responses to injury reveal three phases: extension of cell process, migration and arrival at the injury site (e, n = 28 cells from 6 animals). Scale bar 50 µm (a–d), 20 µm (b′–d′).

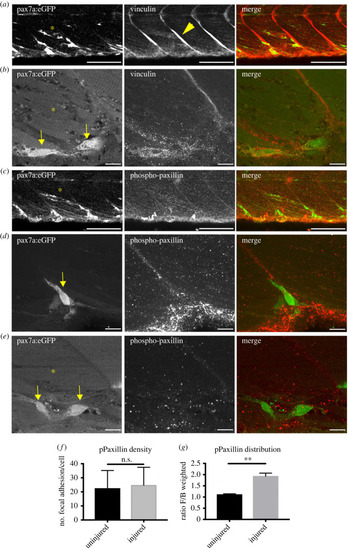
Adhesion molecule localization is polarized in muSCs migrating to injuries. Vinculin is detectable at the myoseptum (arrowheads, a) and is present as puncta on GFP+ cells (arrows, b) in injured (labelled by asterisk) pax7a:egfp larvae. The activated adhesion protein phosphoY118-Paxillin could be detected weakly at the myoseptum in pax7a:egfp larvae (c) and was present as puncta in GFP+ cells at the myoseptum (d) and within the myotome (e). Quantification of adhesion density within GFP+ cells was performed using Imaris with puncta defined as showing a diameter > 1.2 µm (f, n = 16 cells) and distribution of puncta was characterized by defining the ratio at the front compared to the back of a cell relative to the position of the nucleus (g, n = 16 cells). Statistical comparisons were performed by Student t-test and significance indicated (**p < 0.01, N.S. not significant) with n = 3 animals per condition. Scale bars 50 µm (a,c), 10 µm (b,d,e).

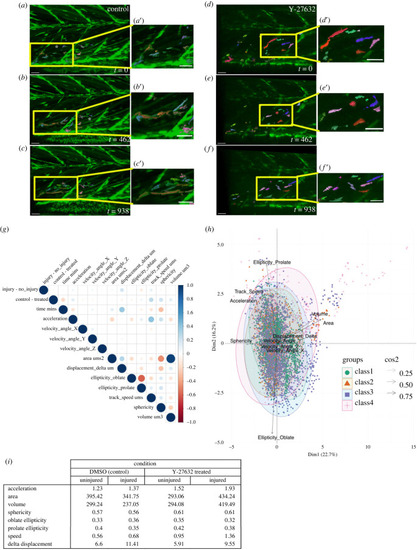
Inhibition of ROCK activity by Y-27632 results in changes to the shape and movement of muSCs responding to injury. Representative images from time-lapsed vidoes of control injured larvae (a–c) and experimental animals exposed to 50 µM Y-27632 (d–f) processed using Imaris to segment cells with inset images (yellow box) showing selected cells in the injured myotomes (a′–f′). Time-lapsed images were captured from 8 hpi and timestamp shown is minutes after start of the time-lapse. Each segmented cell is shown by different colour relative to the GFP signal (green). Measures of cell shape and movement were extracted by Imaris and compared by correlation analysis to identify positive (blue) or negative (red) correlations (g, p values represented by size) across all conditions (g). Principal Component Analysis was used to map relative contributions of variables of cell shape and movement to PC1 and PC2 (line density, cos) for the four classes of data (h, class 1: no injury, untreated, class 2: no injury, Y-27632, class 3: injury, untreated, class 4: injury, Y-27632). Average values of cell shape and speed are shown for each condition (i). Scale bars 30 µm (a–f, a′–f′).

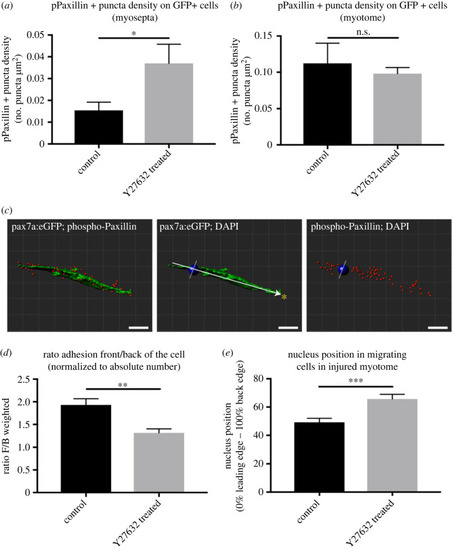
Measures of pPaxillin distribution in GFP+ cells of injured pax7a:egfp larvae in the presence or absence of 50 µM Y-27632. pPaxillin density within GFP+ cells at the myoseptum (a) and within the myotome (b) was measured by defining puncta per µm2 within a GFP+ cell. pPaxillin puncta distribution was measured along the longest axis of the GFP+ cell (defined as the axis towards the injury, arrow) relative to the nucleus (blue ball) in the front, F, or back, B, of the cell (c). A ratio was calculated from the number of puncta at the front and back normalized to the total number of puncta per cell for untreated animals or those treated with Y-27632 (d). The position of the nucleus was measured along the axis and expressed as a % relative to the leading (anterior) or trailing (posterior) edge. In animals treated with Y-27632 the relative position of the nucleus was more posteriorly located in GFP+ cells. Significance of difference was determined by an unpaired Student's t-test (***p < 0.001, **p < 0.01, *p < 0.05, N.S. p > 0.05) with n = 3 animals per condition. Scale bar 10 µm (c).

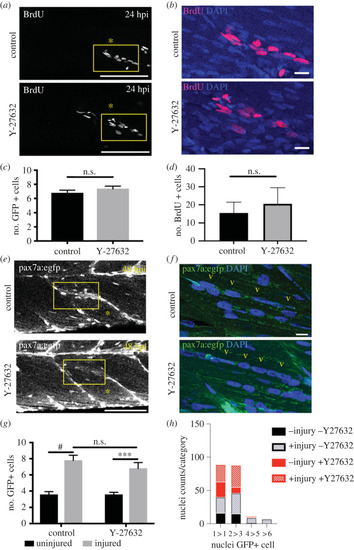
ROCK inhibition does not impair myogenesis during regeneration. Control injured pax7a:egfp larvae (injury location marked by asterisk) or those treated with 10 µM Y-27632 were exposed to BrdU for 24 h (a, enlarged area in b). Quantification of GFP+ cells (c) and BrdU + cells (d) in control and Y-27632 treated pax7a:egfp animals at 24 hpi. The number of GFP+ cells and number of nuclei per GFP+ cells was assessed at 48 hpi in control and Y-27632 treated animals (e, enlarged area in f). Comparison of the relative number of GFP+ cells in regenerating muscle of control animals compared to those treated with Y-27632 (g). Relative nuclear number per newly regenerating GFP + fibre is shown for control and Y-27632 treated animals and represented as classes with 1 nuclei (1 > 1), between 2 to 3 (2 > 3), between 4 to 5 (4 > 5) or more than 6 nuclei per GFP + myofibre (h). Significance was calculated using t-test with Bonferroni correction (c,d), by 2-way ANOVA with Tukey's post-hoc correction (g) or by a Chi-squared test (h) with n = 3 animals per condition. Scale bars 100 µm (a,e), 10 µm (b,f).

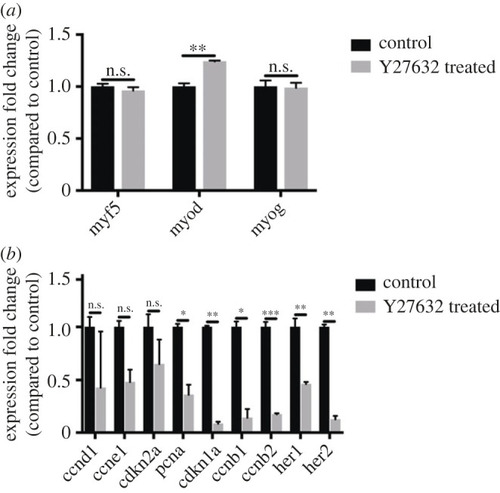
ROCK inhibition impairs myogenesis. Gene expression in regenerating myotomes of control and Y-27632 treated larvae was examined by qPCR at 24 hpi. Myogenic genes myf5, myod and myogenin were compared, but only myod showed an upregulation in Y-27632 treated tissue (a). Cell cycle associated genes pcna, cdkn1a, ccnb1, ccnb2 and Notch activated genes her1 and her2 were downregulated in Y-27632 treated tissue, but ccnd1, ccne1, cdkn2a did not show significant differences (b). The difference in gene expression between control and Y-27632 treated tissue was tested by comparing ΔCt values using an unpaired t-test with Bonferroni correction with significance assumed where p < 0.05 (***p < 0.001, **p < 0.01, *p < 0.05, N.S. p > 0.05).

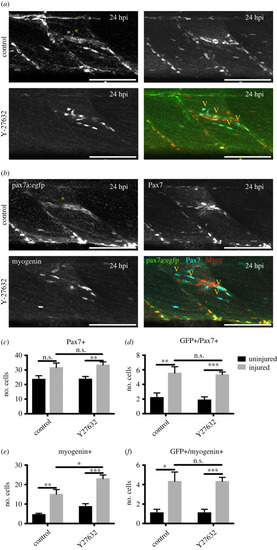
Myogenesis during regeneration of pax7a:egfp larvae was quantified in the absence (a) or presence (b) of Y-27632 by immunolabelling with antibodies to Pax7 (arrowheads), myogenin and GFP. Cells expressing Pax7+, myogenin, pax7a:egfp (GFP+) were counted in injured or uninjured myotomes at 24 hpi (c–f). Significance was tested by unpaired t-tests (*p < 0.05, **p < 0.01, ***p < 0.001) with n = 5 animals per condition. Scale bars 50 µm.

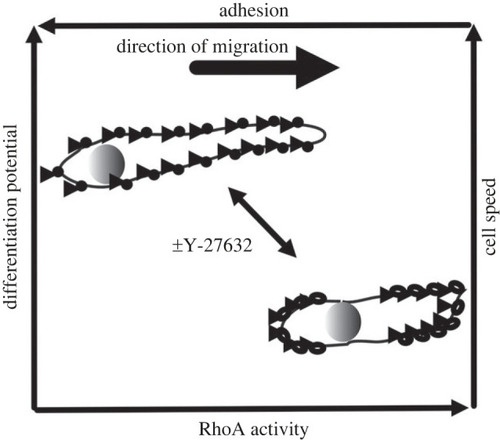
A model for RhoA-dependent migration of muSCs. Migratory muSCs show a RhoA-dependent cell cortex contractility that drives nuclear positioning and cell migration. In an absence of ROCK activity caused by Y-27632, focal adhesions are smaller, less clustered and less polarized along the axis of cell migration leading to reduced adhesion to the extracellular matrix. This correlates with an increased differentiation potential and more rapid migratory behaviour of muSCs.

Acknowledgments
This image is the copyrighted work of the attributed author or publisher, and ZFIN has permission only to display this image to its users. Additional permissions should be obtained from the applicable author or publisher of the image. Full text @ Open Biol.