IMAGE

Figure 6.

ID
ZDB-IMAGE-231002-390
Source
Figures for Brondolin et al., 2023
Image
Figure Caption

Figure 6.

ROCK inhibition impairs myogenesis. Gene expression in regenerating myotomes of control and Y-27632 treated larvae was examined by qPCR at 24 hpi. Myogenic genes
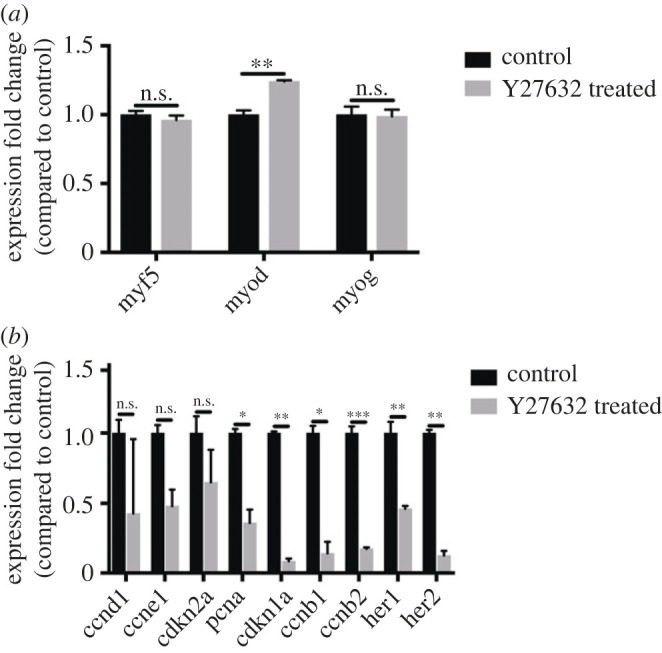
 myf5, myod and myogenin were compared, but only myod showed an upregulation in Y-27632 treated tissue (a). Cell cycle associated genes pcna, cdkn1a, ccnb1, ccnb2 and Notch activated genes her1 and her2 were downregulated in Y-27632 treated tissue, but ccnd1, ccne1, cdkn2a did not show significant differences (b). The difference in gene expression between control and Y-27632 treated tissue was tested by comparing ΔCt values using an unpaired t-test with Bonferroni correction with significance assumed where p < 0.05 (***p < 0.001, **p < 0.01, *p < 0.05, N.S. p > 0.05).

Acknowledgments
This image is the copyrighted work of the attributed author or publisher, and ZFIN has permission only to display this image to its users. Additional permissions should be obtained from the applicable author or publisher of the image. Full text @ Open Biol.