IMAGE

Figure 4.

ID
ZDB-IMAGE-231002-387
Source
Figures for Brondolin et al., 2023
Image
Figure Caption

Figure 4.

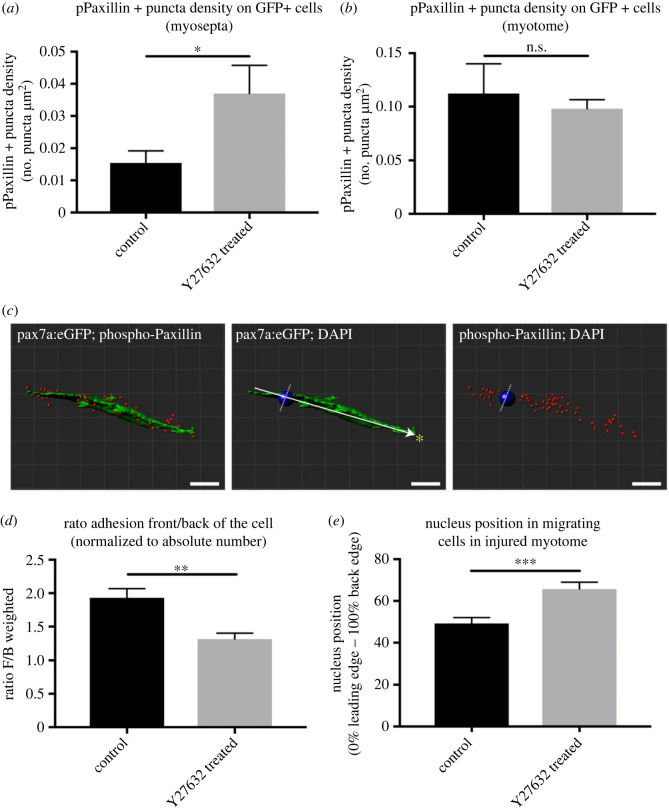
Measures of pPaxillin distribution in GFP+ cells of injured pax7a:egfp larvae in the presence or absence of 50 µM Y-27632. pPaxillin density within GFP+ cells at the myoseptum (a) and within the myotome (b) was measured by defining puncta per µm2 within a GFP+ cell. pPaxillin puncta distribution was measured along the longest axis of the GFP+ cell (defined as the axis towards the injury, arrow) relative to the nucleus (blue ball) in the front, F, or back, B, of the cell (c). A ratio was calculated from the number of puncta at the front and back normalized to the total number of puncta per cell for untreated animals or those treated with Y-27632 (d). The position of the nucleus was measured along the axis and expressed as a % relative to the leading (anterior) or trailing (posterior) edge. In animals treated with Y-27632 the relative position of the nucleus was more posteriorly located in GFP+ cells. Significance of difference was determined by an unpaired Student's t-test (***p < 0.001, **p < 0.01, *p < 0.05, N.S. p > 0.05) with n = 3 animals per condition. Scale bar 10 µm (c).

Acknowledgments
This image is the copyrighted work of the attributed author or publisher, and ZFIN has permission only to display this image to its users. Additional permissions should be obtained from the applicable author or publisher of the image. Full text @ Open Biol.