IMAGE

Figure 3.

ID
ZDB-IMAGE-231002-386
Source
Figures for Brondolin et al., 2023
Image
Figure Caption

Figure 3.

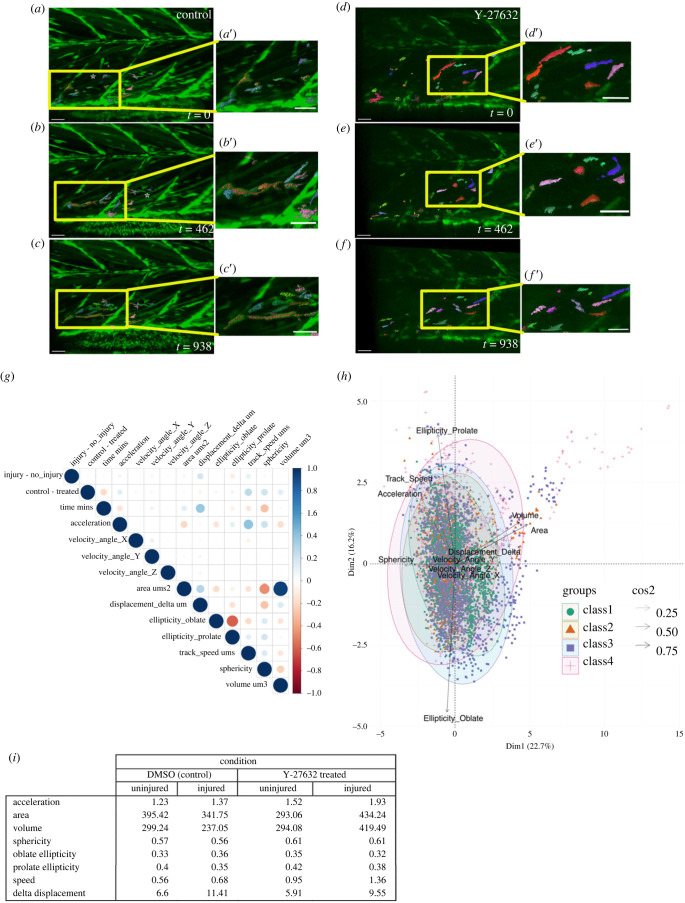
Inhibition of ROCK activity by Y-27632 results in changes to the shape and movement of muSCs responding to injury. Representative images from time-lapsed vidoes of control injured larvae (a–c) and experimental animals exposed to 50 µM Y-27632 (d–f) processed using Imaris to segment cells with inset images (yellow box) showing selected cells in the injured myotomes (a′–f′). Time-lapsed images were captured from 8 hpi and timestamp shown is minutes after start of the time-lapse. Each segmented cell is shown by different colour relative to the GFP signal (green). Measures of cell shape and movement were extracted by Imaris and compared by correlation analysis to identify positive (blue) or negative (red) correlations (g, p values represented by size) across all conditions (g). Principal Component Analysis was used to map relative contributions of variables of cell shape and movement to PC1 and PC2 (line density, cos) for the four classes of data (h, class 1: no injury, untreated, class 2: no injury, Y-27632, class 3: injury, untreated, class 4: injury, Y-27632). Average values of cell shape and speed are shown for each condition (i). Scale bars 30 µm (a–f, a′–f′).

Acknowledgments
This image is the copyrighted work of the attributed author or publisher, and ZFIN has permission only to display this image to its users. Additional permissions should be obtained from the applicable author or publisher of the image. Full text @ Open Biol.