FIGURE SUMMARY
Title

Venetoclax is a potent hepsin inhibitor that reduces the metastatic and prothrombotic phenotypes of hepsin-expressing colorectal cancer cells

Authors
Rodenas, M.C., Peñas-Martínez, J., Pardo-Sánchez, I., Zaragoza-Huesca, D., Ortega-Sabater, C., Peña-García, J., Espín, S., Ricote, G., Montenegro, S., Ayala-De La Peña, F., Luengo-Gil, G., Nieto, A., García-Molina, F., Vicente, V., Bernardi, F., Lozano, M.L., Mulero, V., Pérez-Sánchez, H., Carmona-Bayonas, A., Martínez-Martínez, I.
Source
Full text @ Front Mol Biosci

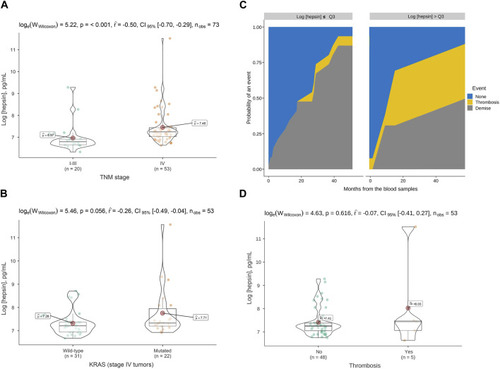
Hepsin levels in plasma of colorectal cancer patients and association with tumor stage, KRAS mutation and thrombosis. (A) Violin boxplot showing the association between the logarithm of the hepsin concentration and TNM stage, (B) and the presence of KRAS mutations in advanced cancer patients. (C) Cumulative incidence function for thrombosis among advanced cancer patients. The third quartile of the hepsin level distribution was used to stratify the curves. (D) Violin box-plots showing the log hepsin concentration in advanced cancer patients with or without thrombosis. p, p-value; CI, confidence interval; nobs, number of patients; TNM, tumor, node, metastases; Q3, third quartile.

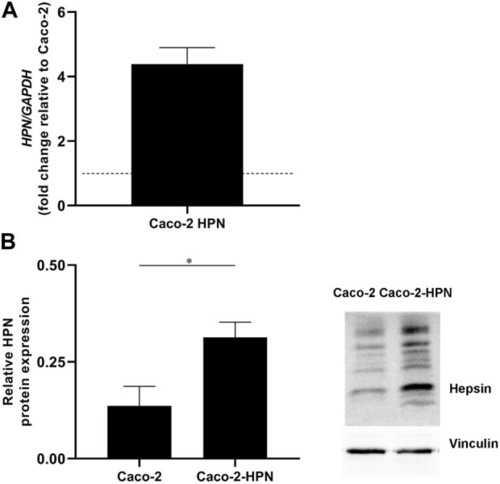
Hepsin overexpression in Caco-2-HPN cells. (A) The hepsin mRNA levels were deter-mined in Caco-2 and Caco-2-HPN cells by RT-qPCR. Gene expression levels were normalized to b-actin mRNA levels and the data are represented as the mean ± standard error of the mean of technical triplicates. Levels were shown as fold increase relative to the mean of Caco-2 cells. (B) Hepsin protein levels were determined in Caco-2 and Caco-2-HPN cells by electrophoresis and Western blot in lysates of Caco-2 and Caco-2-HPN cells. Vinculin expression was detected as loading control to relativize hepsin levels. Data are represented as the mean ± standard error of the mean of technical triplicates. HPN, Hepsin; Caco-2-HPN, Caco-2 cells overexpressing hepsin; Caco-2, Caco-2 cells with hepsin basal expression; *: p-value < 0.05.

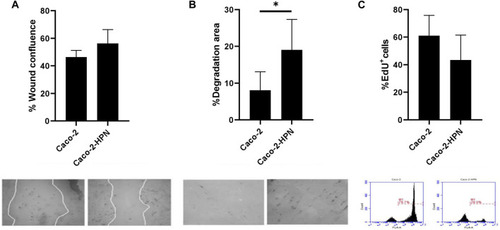
Effects of hepsin levels on cell migration, invasion and proliferation in Caco-2 and Caco-2-HPN cells. (A) Percentage of wound confluence was evaluated after 48 h of the wound created with a pipette tip in Caco-2 and Caco-2-HPN. Six different images were processed for each sample. Images were recorded with a Leica microscope at 5× and Fiji-ImageJ was used to analyze migration. The graph represents the mean ± standard error of the mean of the replicates. Under the graph, the white continuous lines represent the limits of the space without cell monolayers after 48 h of the wound. (B) Percentage of cells invading gelatin matrix was evaluated after 72 h of cell culture in the matrix. Images were taken with a confocal spectral scanning microscope SP8 LEICA, analyzed with ImageJ and GIMP software, and processed with Fiji-ImageJ. Six different images were processed for each sample. Cells that degraded gelatin were scored as positive. The graph represents the mean ± standard error of the mean of the replicates. Under the graph, black points on the bright matrix represent cells that have invaded or degraded gelatin. (C) The percentage of EdU positive cells was determined in Caco-2 and Caco-2-HPN cells by flow cytometry after 48 h of cell culture. Each condition was evaluated in triplicate. The graph represents the mean ± standard error of the mean of the replicates. Under the graph, we show representative plots from EdU assay by flow cytometry. Edu fluorescence was detected by FL4-A channel. Caco-2-HPN, Caco-2 cells overexpressing hepsin; Caco-2, Caco-2 cells with hepsin basal expression; *: p-value < 0.05; EdU+, positive for 5-ethynyl-2′-deoxyuridine; M1, cells proliferating according to Edu.

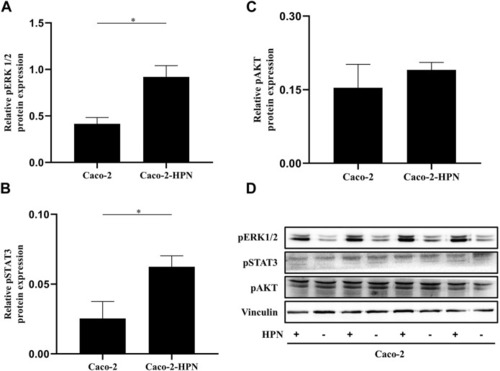
pSTAT3, pAKT and pERK1/2 expression in Caco-2 and Caco-2-HPN cells. Expression of pERK1/2 (A), pSTAT3 (B) and pAKT (C) determined by electrophoresis and Western blot in lysates of Caco-2 and Caco-2-HPN cells in triplicates. Levels were determined by densitometry and represented as relative protein expression to vinculin. Graphs represent the mean ± standard error of the mean of the triplicates. (D) Electrophoresis and Western blot of pSTAT3, pAKT and pERK1/2 in lysates of Caco-2 and Caco-2-HPN cells in triplicates. Vinculin expression was detected as loading control. pERK1/2, phospho-extracellular signal-regulated kinases 1 and 2; pSTAT3, phospho-signal transducer and activator of transcription 3; pAKT, phospho-Protein Kinase B; Caco-2-HPN, Caco-2 cells overexpressing hepsin; Caco-2, Caco-2 cells with hepsin basal expression; *: p-value < 0.05; HPN, Hepsin; +, overexpression; -, basal expression.

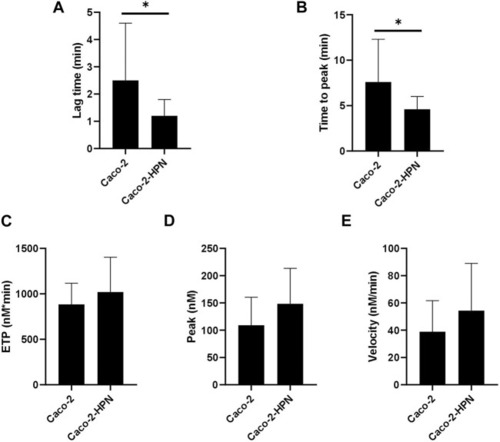
Effects of hepsin levels on thrombin generation by Caco-2 and Caco-2-HPN cells. Thrombin generation was performed after incubation of plasma with cells for 3 h as described in Materials and Methods. Afterwards, plasma was incubated with PPP reagent ® (final concentrations: tissue factor, 1 pmol/L; phospholipids, 4 μmol/L) and calcium chloride. The lag time (min) (A), time to peak (min) (B), endogenous thrombin potential (ETP, nmol*min) (C), thrombin peak (peak, nmol) (D), and mean rate index (Velocity, nmol/min) (E) were recorded. The data represent the mean ± standard error of the mean of at least six separate experiments. Caco-2-HPN, Caco-2 cells overexpressing hepsin; Caco-2, Caco-2 cells with hepsin basal expression; *: p-value < 0.05.

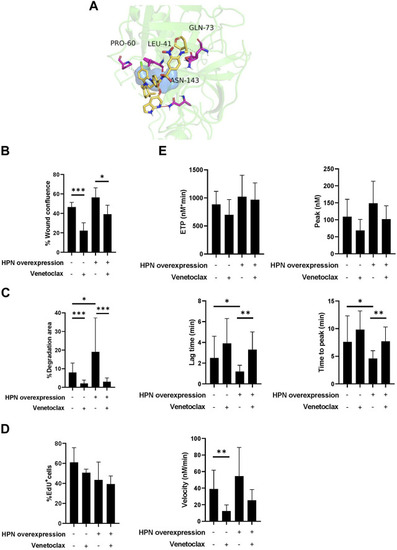
Venetoclax reduces protumor and prothrombotic effects of hepsin in colorectal cancer cells. (A) Obtained pose from molecular docking between venetoclax and hepsin. Venetoclax is shown in yellow skeleton, while hydrophobic interactions are represented in dashes, and hydrogen bonds with a red line. Catalytic triad is shown in blue surface, and hepsin amminoacids interacting with venetoclax are represented in fuchsia. (B) Percentage of wound confluence was evaluated after 48 h of the wound created with a pipette tip in Caco-2 and Caco-2-HPN, in the presence and absence of 1.88 µM venetoclax. Six different images were processed for each sample. Images were recorded with a Leica microscope at 5× and Fiji-ImageJ was used to analyze migration. The graph represents the mean ± standard error of the mean of the replicates. (C) Percentage of cells invading gelatin matrix were evaluated after 72 h of cell culture in the matrix, in presence and absence of 1.88 µM venetoclax. Images were taken with a confocal spectral scanning microscope SP8 LEICA, analyzed with ImageJ and GIMP software, and processed with Fiji-ImageJ. Cells that degraded gelatin were scored as positive. The graph represents the mean ± standard error of the mean of the replicates. (D) The percentage of EdU positive cells was determined in Caco-2 and Caco-2-HPN cells by flow cytometry after 48 h of cell culture in presence and absence of 1.88 µM venetoclax. The graph represents the mean ± standard error of the mean of the replicates. (E) Thrombin generation was performed after incubation of plasma with cells in presence and absence of 1.88 µM venetoclax as described in Materials and Methods. The endogenous thrombin potential (ETP, nmol*min), thrombin peak (peak, nmol), lag time (min), time-to-peak (min) and mean rate index (velocity, nmol/min) were recorded. The data represent the mean ± standard error of the mean of at least six separate experiments. Each condition was evaluated in triplicate. PRO60, proline-60; LEU41, leucine-41; GLN73, glutamine-73; ASN143, asparagine-143; HPN, Hepsin; EdU+, positive for 5-ethynyl-2′-deoxyuridine; *: p-value < 0.05; **: p-value < 0.01; ***: p-value < 0.001.

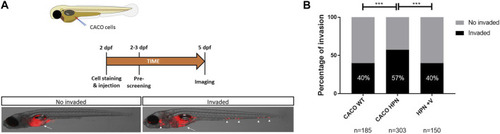
Venetoclax reduces Caco-2-HPN cell invasion in zebrafish larvae. (A) Experimental design of the zebrafish larvae xenotransplantation experiments and representative pictures of no invaded and invaded larvae showing red-labelled Caco-2 cells at the injection site (arrow) and several invasion foci (arrowheads). (B) Evaluation of invasion score 3 days after injection in the yolk sac of 2-dpf casper zebrafish larvae. The results showed are a pool of three different experiments. dpf, days post-fertilization; ***: p-value < 0.001; n, number of larvae per treatment; CACO WT, Caco-2 cells with hepsin basal expression; CACO HPN, Caco-2 cells overexpressing hepsin; HPN + V, Caco-2 cells overexpressing hepsin pretreated with venetoclax.

Acknowledgments
This image is the copyrighted work of the attributed author or publisher, and ZFIN has permission only to display this image to its users. Additional permissions should be obtained from the applicable author or publisher of the image. Full text @ Front Mol Biosci