IMAGE

FIGURE 1

ID
ZDB-IMAGE-230606-7
Source
Figures for Rodenas et al., 2023
Image
Figure Caption

FIGURE 1

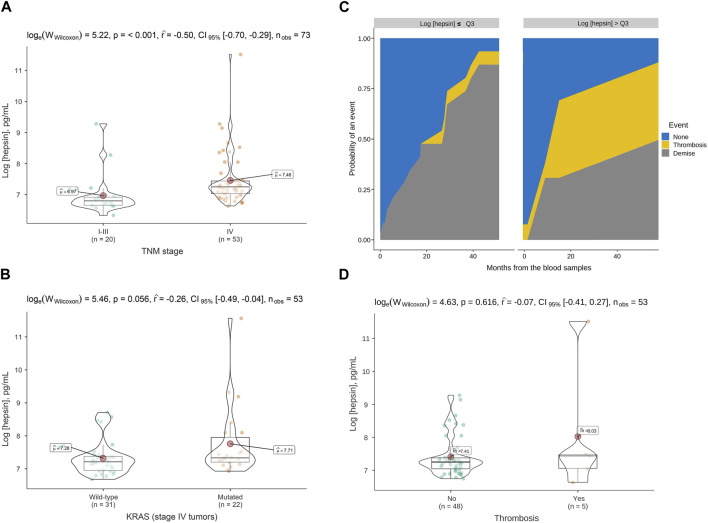
Hepsin levels in plasma of colorectal cancer patients and association with tumor stage, KRAS mutation and thrombosis. (A) Violin boxplot showing the association between the logarithm of the hepsin concentration and TNM stage, (B) and the presence of KRAS mutations in advanced cancer patients. (C) Cumulative incidence function for thrombosis among advanced cancer patients. The third quartile of the hepsin level distribution was used to stratify the curves. (D) Violin box-plots showing the log hepsin concentration in advanced cancer patients with or without thrombosis. p, p-value; CI, confidence interval; nobs, number of patients; TNM, tumor, node, metastases; Q3, third quartile.

Acknowledgments
This image is the copyrighted work of the attributed author or publisher, and ZFIN has permission only to display this image to its users. Additional permissions should be obtained from the applicable author or publisher of the image. Full text @ Front Mol Biosci