IMAGE

FIGURE 6

ID
ZDB-IMAGE-230606-12
Source
Figures for Rodenas et al., 2023
Image
Figure Caption

FIGURE 6

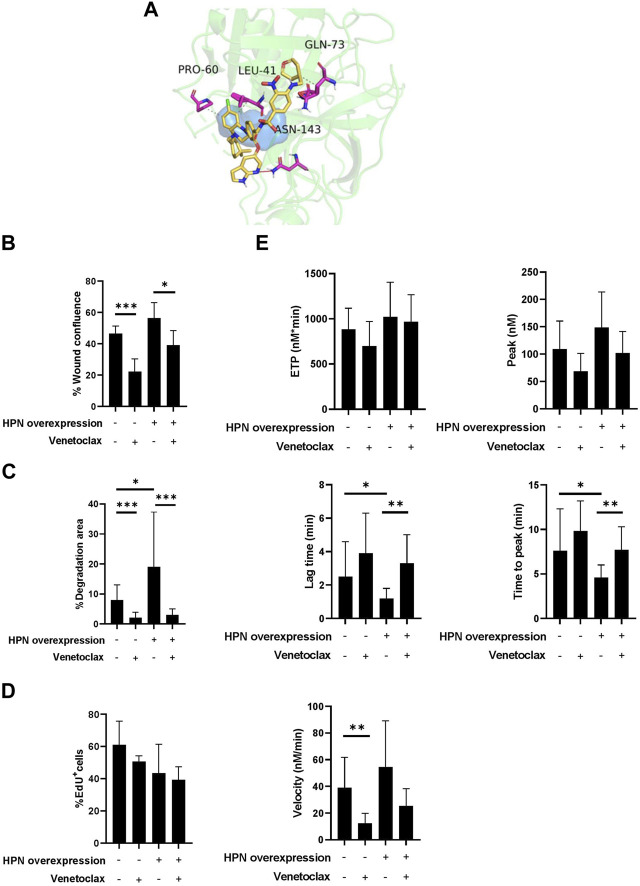
Venetoclax reduces protumor and prothrombotic effects of hepsin in colorectal cancer cells. (A) Obtained pose from molecular docking between venetoclax and hepsin. Venetoclax is shown in yellow skeleton, while hydrophobic interactions are represented in dashes, and hydrogen bonds with a red line. Catalytic triad is shown in blue surface, and hepsin amminoacids interacting with venetoclax are represented in fuchsia. (B) Percentage of wound confluence was evaluated after 48 h of the wound created with a pipette tip in Caco-2 and Caco-2-HPN, in the presence and absence of 1.88 µM venetoclax. Six different images were processed for each sample. Images were recorded with a Leica microscope at 5× and Fiji-ImageJ was used to analyze migration. The graph represents the mean ± standard error of the mean of the replicates. (C) Percentage of cells invading gelatin matrix were evaluated after 72 h of cell culture in the matrix, in presence and absence of 1.88 µM venetoclax. Images were taken with a confocal spectral scanning microscope SP8 LEICA, analyzed with ImageJ and GIMP software, and processed with Fiji-ImageJ. Cells that degraded gelatin were scored as positive. The graph represents the mean ± standard error of the mean of the replicates. (D) The percentage of EdU positive cells was determined in Caco-2 and Caco-2-HPN cells by flow cytometry after 48 h of cell culture in presence and absence of 1.88 µM venetoclax. The graph represents the mean ± standard error of the mean of the replicates. (E) Thrombin generation was performed after incubation of plasma with cells in presence and absence of 1.88 µM venetoclax as described in Materials and Methods. The endogenous thrombin potential (ETP, nmol*min), thrombin peak (peak, nmol), lag time (min), time-to-peak (min) and mean rate index (velocity, nmol/min) were recorded. The data represent the mean ± standard error of the mean of at least six separate experiments. Each condition was evaluated in triplicate. PRO60, proline-60; LEU41, leucine-41; GLN73, glutamine-73; ASN143, asparagine-143; HPN, Hepsin; EdU+, positive for 5-ethynyl-2′-deoxyuridine; *: p-value < 0.05; **: p-value < 0.01; ***: p-value < 0.001.

Acknowledgments
This image is the copyrighted work of the attributed author or publisher, and ZFIN has permission only to display this image to its users. Additional permissions should be obtained from the applicable author or publisher of the image. Full text @ Front Mol Biosci