IMAGE

FIGURE 3

ID
ZDB-IMAGE-230606-9
Source
Figures for Rodenas et al., 2023
Image
Figure Caption

FIGURE 3

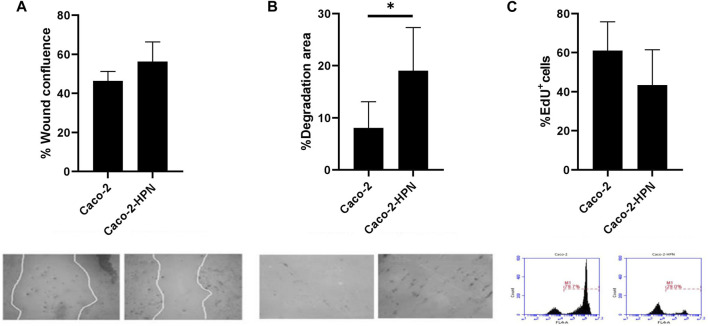
Effects of hepsin levels on cell migration, invasion and proliferation in Caco-2 and Caco-2-HPN cells. (A) Percentage of wound confluence was evaluated after 48 h of the wound created with a pipette tip in Caco-2 and Caco-2-HPN. Six different images were processed for each sample. Images were recorded with a Leica microscope at 5× and Fiji-ImageJ was used to analyze migration. The graph represents the mean ± standard error of the mean of the replicates. Under the graph, the white continuous lines represent the limits of the space without cell monolayers after 48 h of the wound. (B) Percentage of cells invading gelatin matrix was evaluated after 72 h of cell culture in the matrix. Images were taken with a confocal spectral scanning microscope SP8 LEICA, analyzed with ImageJ and GIMP software, and processed with Fiji-ImageJ. Six different images were processed for each sample. Cells that degraded gelatin were scored as positive. The graph represents the mean ± standard error of the mean of the replicates. Under the graph, black points on the bright matrix represent cells that have invaded or degraded gelatin. (C) The percentage of EdU positive cells was determined in Caco-2 and Caco-2-HPN cells by flow cytometry after 48 h of cell culture. Each condition was evaluated in triplicate. The graph represents the mean ± standard error of the mean of the replicates. Under the graph, we show representative plots from EdU assay by flow cytometry. Edu fluorescence was detected by FL4-A channel. Caco-2-HPN, Caco-2 cells overexpressing hepsin; Caco-2, Caco-2 cells with hepsin basal expression; *: p-value < 0.05; EdU+, positive for 5-ethynyl-2′-deoxyuridine; M1, cells proliferating according to Edu.

Acknowledgments
This image is the copyrighted work of the attributed author or publisher, and ZFIN has permission only to display this image to its users. Additional permissions should be obtained from the applicable author or publisher of the image. Full text @ Front Mol Biosci