IMAGE

FIGURE 2

ID
ZDB-IMAGE-230606-8
Source
Figures for Rodenas et al., 2023
Image
Figure Caption

FIGURE 2

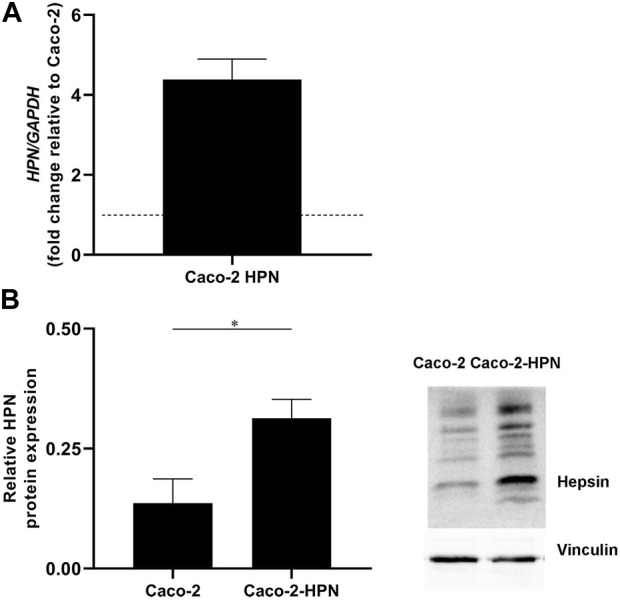
Hepsin overexpression in Caco-2-HPN cells. (A) The hepsin mRNA levels were deter-mined in Caco-2 and Caco-2-HPN cells by RT-qPCR. Gene expression levels were normalized to b-actin mRNA levels and the data are represented as the mean ± standard error of the mean of technical triplicates. Levels were shown as fold increase relative to the mean of Caco-2 cells. (B) Hepsin protein levels were determined in Caco-2 and Caco-2-HPN cells by electrophoresis and Western blot in lysates of Caco-2 and Caco-2-HPN cells. Vinculin expression was detected as loading control to relativize hepsin levels. Data are represented as the mean ± standard error of the mean of technical triplicates. HPN, Hepsin; Caco-2-HPN, Caco-2 cells overexpressing hepsin; Caco-2, Caco-2 cells with hepsin basal expression; *: p-value < 0.05.

Acknowledgments
This image is the copyrighted work of the attributed author or publisher, and ZFIN has permission only to display this image to its users. Additional permissions should be obtained from the applicable author or publisher of the image. Full text @ Front Mol Biosci