
- Title
-
gldc Is Essential for Renal Progenitor Patterning during Kidney Development
- Authors
- Weaver, N.E., Healy, A., Wingert, R.A.
- Source
- Full text @ Biomedicines

A severe gldc deficient model exhibits phenotypes consistent with impaired kidney function. (A) Live images of WT and gldc morphants at 24 hpf, 48 hpf, and 72 hpf. Images at 24 hpf reveal gray pallor within the head of gldc morphants. At 48 hpf, pericardial edema becomes evident and persists through 72 hpf. At 72 hpf, craniofacial cartilage begins to develop, and abnormalities are observed. Scale bars = 100 μM, 400 μM. (B) WISH of WT gldc expression at 24 hpf, 48 hpf, and 72 hpf reveals gldc transcripts within the CNS and pronephros. Scale bars = 200 μM (main image) and 50 μM (inset). (C) Alcian Blue cartilage staining in WT and gldc morphants at 4 dpf. Decreased number of pharyngeal arches and aberrant jaw morphology were seen in gldc morphants. Scale bars = 100 μM, 50 μM, 50 μM. (D) A survival curve of WT animals and gldc morphants reveals that gldc deficient animals have a decreased percent survivability over seven days. EXPRESSION / LABELING:
|
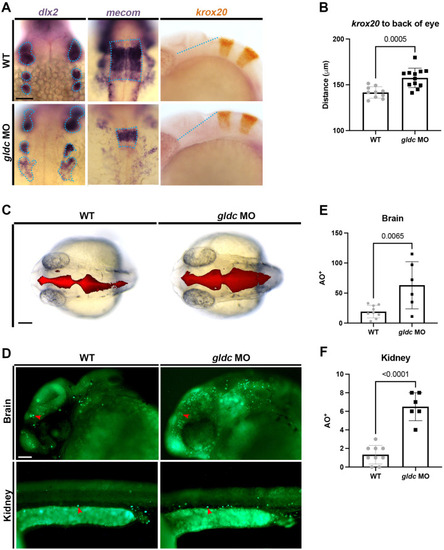
gldc deficient zebrafish display phenotypes consistent with Gldc deficient mammals. (A) WISH analysis of mecom in WT and gldc morphants revealed an altered rhombomere four. gldc morphants exhibited disorganized migrating neural crest cell populations marked with dlx2. krox20, a gene expressed in rhombomeres three and five, appeared shifted in comparison to the back of the eye. Scale bar = 50 μM. (B) Quantification of the distance between the edge of rhombomere three and the back of the eye. (C) Injections of dextran-rhodamine into the brain ventricles of live WT and gldc morphant animals at 24 hpf. In gldc morphants, brain ventricles appear enlarged. Scale bar = 50 μM. (D) Acridine Orange assay in WT and gldc morphants at 24 hpf; red arrowheads indicate example AO+ cells. Scale bar = 50 μM. (E,F) Quantification of AO+ cells in the brain and kidney, respectively. Distance measurements and cell counts were compared by unpaired T-tests. Significant differences are shown above the brackets. |
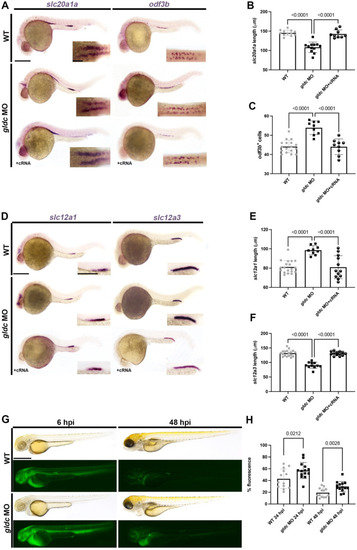
gldc is necessary for proper segment patterning. (A) WISH of slc20a1a and odf3b in WT, gldc MO, and gldc MO + cRNA at 24 hpf. Scale bars = 200 μM (main image) and 50 μM (inset). (B) Absolute length quantification of slc20a1a domain in control and treatment groups. (C) Quantification of odf3b+ cells in WT, gldc MO, and gldc MO + cRNA. (D) WISH of slc12a1 and slc12a3 in WT, gldc MO, and gldc MO + cRNA at 24 hpf. Scale bars = 200 μM (main image) and 50 μM (inset). (E,F) Absolute length quantification of slc12a1 and slc12a3 domains, respectively. (G) Animals were injected with dextran-FITC at 24 hpf, then imaged at 6 hpi and 48 hpi. Scale bar = 400 μM. (H) Quantifications of percent fluorescence at 24 hpi and 48 hpi. Percent fluorescence was calculated with 6 hpi fluorescent intensity as baseline. Data are mean ± s.d. quantified for each control and experimental group. Absolute lengths and odf3b+ cell counts were compared using ANOVA. Percent fluorescence measurements were compared with unpaired T-tests. EXPRESSION / LABELING:
PHENOTYPE:
|
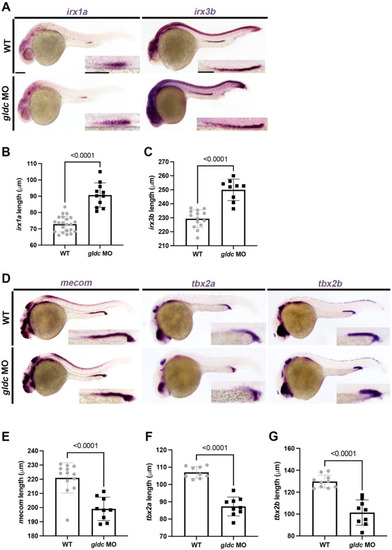
Loss of gldc affects DE and DL precursor populations. (A) WISH of irx1a and irx3b in WT and gldc morphant embryos at 24 hpf. Scale bars = 100 μM (main image) and 50 μM (inset). (B,C) Absolute length measurements of irx1a and irx3b domains. (D) WISH of mecom, tbx2a, and tbx2b on WT and gldc MO embryos at 24 hpf. Scale bars = 100 μM (main image) and 50 μM (inset). (E–G) Absolute length measurements of mecom, tbx2a, and tbx2b domains quantified for each control and experimental group. Data are mean ± s.d. Absolute lengths were compared using unpaired T-tests. |
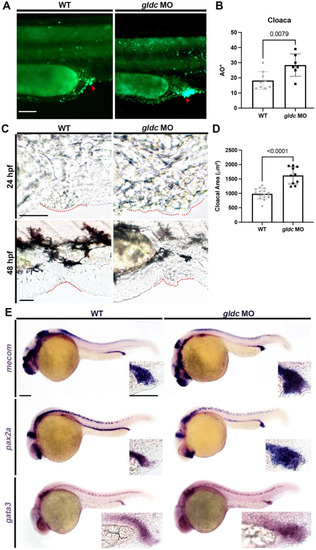
gldc morphant cloacae demonstrate increased levels of apoptosis and structural abnormalities. (A) Cell death assay of the cloaca in WT and gldc morphants at 24 hpf. Scale bar = 50 μM. (B) Quantification of AO+ cells in the cloaca; red arrowheads indicate example AO+ cells. (C) Live images of the cloacal region (outlined in red) in WT and gldc morphants at 24 hpf and 48 hpf. Scale bars = 50 μM. (D) Measurement of the cloacal area in WT and gldc MO. (E) WISH of mecom, pax2a, and gata3 in WT and gldc morphants at 24 hpf revealed enlarged cloacal regions. Scale bars = 100 μM. Data are mean ± s.d. AO+ cell counts and cloacal area were compared with unpaired T-tests. |
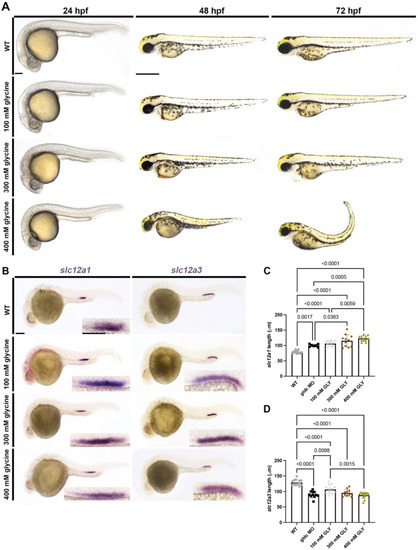
Glycine-treated embryos altered live morphology and segment patterning in a dose-dependent manner, comparable to gldc morphants. (A) Live images of WT and glycine-treated animals at 24 hpf, 48 hpf, and 72 hpf. Animals were treated with three different concentrations of glycine: 100 mM, 300 mM, and 400 mM. Imaging revealed gray pallor in the brain at 24 hpf in 300 mM and 400 mM animals. Pericardial edema and hydrocephalus became evident in 300 mM zebrafish at 48 hpf and became severe at 72 hpf with aberrant jaw morphology. Mild fluid retention was seen in 100 mM animals at 72 hpf. Zebrafish treated with 400 mM glycine exhibited severe body curvature and overall altered morphology at 72 hpf. Scale bars = 100 μM (24 hpf) and 400 μM (48 hpf and 72 hpf). (B) WISH of WT and glycine-treated zebrafish at 24 hpf analyzing slc12a1 and slc12a3. The slc12a1 domain elongates in glycine-treated animals in a dose-dependent manner. The slc12a3 domain becomes reduced in the treatment group in a dose-dependent manner as well. Scale bars = 100 μM (main image) and 50 μM (inset). (C,D) Absolute length quantifications of slc12a1 and slc12a3 comparing WT and treatment groups. Data are mean ± s.d. Absolute lengths were compared with ANOVA. EXPRESSION / LABELING:
PHENOTYPE:
|
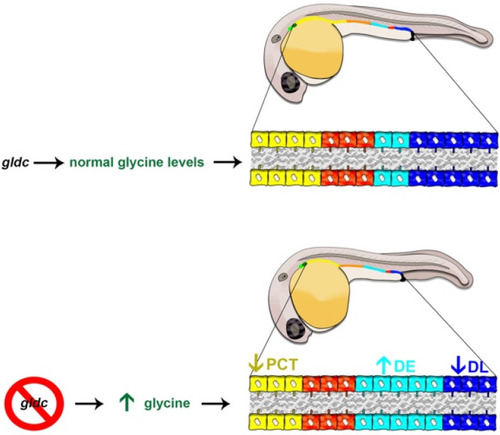
Nephrogenesis in the WT zebrafish embryo compared to gldc deficiency which leads to lethal elevated glycine levels. (Top) At 24 hpf, when the nephron segment pattern is established, WT embryos exhibit nephrons tubules with a series of four segments: the PCT (yellow-colored cells), PST (orange-colored cells), DE (turquoise-colored cells) and DL (dark blue colored cells). (Bottom) nephron tubule segment populations are altered in gldc deficient zebrafish, such that the PCT segment is decreased in size (arrow down), while the DE segment population is expanded (arrow up) and the DL segment is decreased (arrow down). These alterations correlate with changes in the expression of essential renal progenitor genes, observations that provide a crucial foundation for future studies to elucidate the underlying molecular mechanisms of these nephrogenesis defects. |