
- Title
-
The developmental progression of eight opsin spectral signals recorded from the zebrafish retinal cone layer is altered by the timing and cell type expression of thyroxin receptor β2 (trβ2) gain-of-function transgenes
- Authors
- Nelson, R.F., Balraj, A., Suresh, T., Elias, L.J., Yoshimatsu, T., Patterson, S.S.
- Source
- Full text @ eNeuro
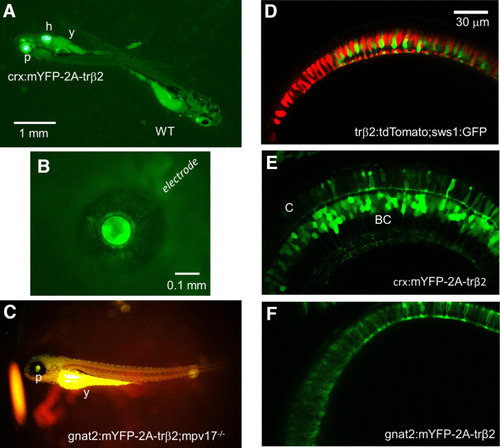
Reporter fluorescence of zebrafish larvae. A, Larvae from outcrosses of crx:mYFP-2A-trβ2 heterozygotes are either heterozygous or wild-type controls (WT). The heterozygotes are recognized by both pupil (p) and heart (h) fluorescence. The yolk sac (y) is autofluorescent. B, The cornea of a 5-d transgenic eye isolated from a crx:mYFP-2A-trβ2 larva is penetrated with a patch electrode for ERG recordings. The eye is <0.5-mm diameter. C, The gnat2:mYFP-2A-trβ2;mpv17−/− gain-of-function phenotype is studied on a roy orbison (mpv17−/−) background strain. The darkly pigmented, nonreflective iris of this control strain aids in visualizing the dim transgenic fluorescence of the pupil (p). The yoke (y) is autofluorescent. D–F, Live confocal imaging of retinas in 6-dpf larvae. D, WT red (red) and UV (green) cone morphology visualized with trβ2:tdTomato and sws1:GFP fluorescent reporter transgenes. E, The mYFP construct in the crx:mYFP-2A-trβ2 transgene causes cones (C) and bipolar cells (BC) to fluoresce. F, The mYFP construct in the transgene gnat2:mYFP-2A-trβ2 marks only cone cells. |
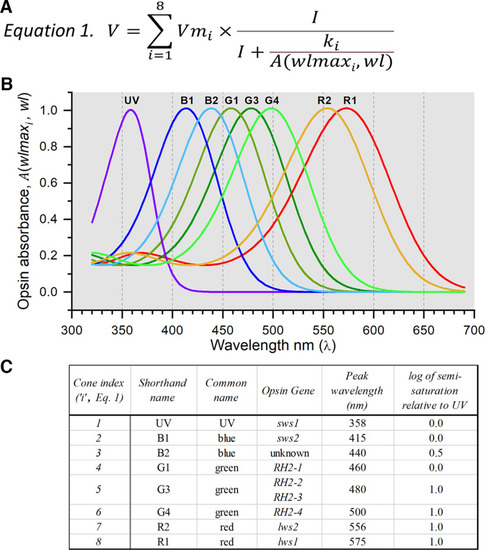
Algorithm for determining the signal strengths of the different cone types contributing to ERG spectral data. |
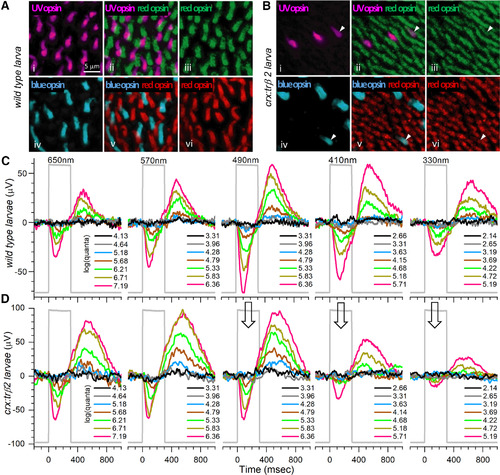
Opsin distributions and spectral responses in embryonic wild-type and crx:mYFP-2A-trβ2 larval eyes. Ai, UV opsin (SWS1) immunoreactive cones in a WT retina. Aiii, Avi, Red opsin (LWS1, LWS2) immunoreactive cones in WT retinas. Aiv, Blue-opsin (SWS2) immunoreactive cones in a WT retina. Aii, UV and red opsins are expressed in separate cones in a WT retina. Av, Red and blue opsins are expressed in separate cones in a WT retina. Bi, UV-opsin immunoreactive cones in a crx:trβ2 retina. Biii, Bvi, Red-opsin immunoreactive cones in crx:trβ2 retinas. Biv, Blue-opsin immunoreactive cones in a crx:trβ2 retina. There are fewer UV and blue cones in crx:trβ2 retinas than in WT retinas. Bii, One crx:trβ2 cone is immunoreactive for both UV and red opsins (arrowhead). Bv, Arrowhead points to a crx:trβ2 cone immunoreactive for both red and blue opsins. C, Cone signals from a WT larval eye respond to all stimulus wavelengths with largest amplitudes at 490 nm. D, A larval crx:trβ2 retina responds with maximal amplitudes at wavelengths 490, 570, and 650 nm but is less responsive than WT for 330, 410, and 490 nm (arrows), wavelengths that stimulate blue and UV cones. A, B, 5-dpf larvae. C, D, 6-dpf larvae. Perfusion medium contains 20 mm aspartate to isolate photoreceptor signals in the ERG. Five of nine stimulus-protocol wavelengths are illustrated. The stimulus irradiances [units of log(quanta·μm−2·s−1)] appear in legends to the right of stacked irradiance-response traces. |
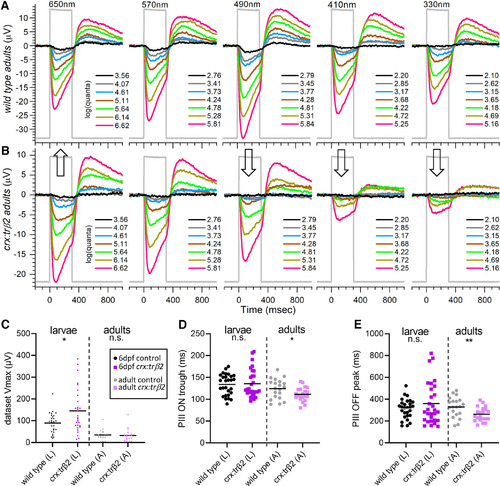
Adult cone spectral signals in WT and crx:mYFP-2A-trβ2 retinas. A, In WT eyecups, all wavelengths and most irradiances evoke signals, with a maximal response at 490 nm. B, Cone signals from crx:trβ2 eyecups are maximal at 650 nm, where they are relatively greater than WT (up arrow). Response amplitudes to wavelengths that stimulate blue and UV cones (330, 410, and 330 nm) are relatively less than WT (down arrows). In A and B, adults are 8–18 months. The perfusion medium contains 10 mm aspartate to isolate photoreceptor signals. The nested responses are irradiance-response series at each wavelength, with irradiances given in legends to the right of the traces in units of log(quanta·μm−2·s−1). C–E, Properties of ERG cone-PIII waveforms in larval and adult, WT and crx:trβ2 retinas. C, Distributions of maximal trough-to-peak amplitudes in larval and adult spectral datasets. D, Cone-signal latency from stimulus onset to the minimum of the ON trough of the cone signal are measured on the mean responses of each 280-stimulus spectral dataset. E, Cone-signal latency to the OFF peak in the mean responses of spectral datasets. OFF latencies are measured from stimulus offset. Asterisks (n.s., not significant) are probabilities that WT and crx:trβ2 distributions differ in larvae or adults (GraphPad Prism convention, statistics given in text). |
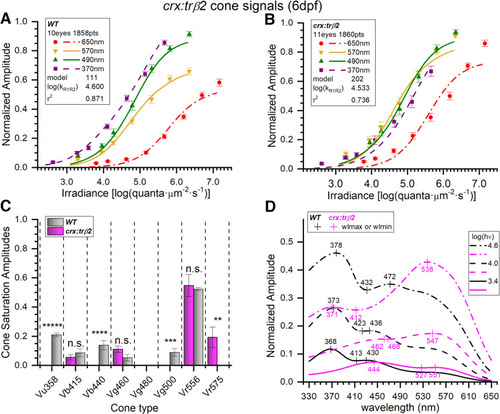
Spectral models of cumulative data from 6-dpf embryonic crx:mYFP-2A-trβ2 and wild-type eyes. A, WT irradiance-response datapoints, SEs, and optimal model (#111) curves as fit to 1858 spectral response amplitudes combined from 28 normalized datasets taken from 10 eyes (Fig. 1A, Eq. 1 algorithm); 370 nm, n = 23–28; 490 nm, n = 27–28; 570 nm; n = 23–28; 650 nm, n = 23–55. B, crx:trβ2 irradiance-response datapoints and optimal model (#202) curves fit to 1860 spectral points combined from 29 datasets taken from 11 eyes. Individual points: 370 nm, n = 22–28; 490 nm, n = 23–28; 570 nm, n = 27–28; 650 nm, n = 24–55. The crx:trβ2 transgene moves curves and points along the irradiance axis as compared with WT. C, In WT, six cone opsin types (gray bars) were detected by the optimal model. In crx:trβ2, four cone opsin signals were detected (magenta bars). Cone saturation amplitudes [Vmi values (Eq. 1; Fig. 2A) ± SE] are fractions of dataset maximal amplitudes. Asterisks denote significance of differences between WT and crx:trβ2 (one-sample or two-sample t tests; n.s., not significant; GraphPad Prism convention). Vu358 (UV, one-sample test): t(1822) = 17.8, p = 1.2 × 10−65; Vb415 (B1): t(3647) = 0.958, p = 0.338; Vb440 (B2): t(1822) = 4.27, p = 2.0 × 10⁻⁵; Vg460 (G1): t(3647) = 1.87, p =0.062; Vg500 (G4, one-sample test): t(1822) = 3.33, p = 8.8 × 10⁻⁴; Vr556 (R2): t(3647) = 0.318, p = 0.751; Vr575 (R1): t(1825) = 2.72, p = 0.0067. D, Spectral peaks shift to longer wavelengths for crx:trβ2 (magenta) as compared with WT (black). Spectral curves are the modeled amplitudes that would be evoked by three different irradiances of constant quantal stimulation across the spectrum [3.4, 4.0, and 4.6 log(quanta·μm−2·s−1)]. Spectral shapes differ with stimulus brightness. A, B, The log(kR1R2) values are modeled R1-cone and R2-cone semi-saturation irradiances in log(quanta·μm−2·s−1). A–D, 20 mm aspartate medium. |
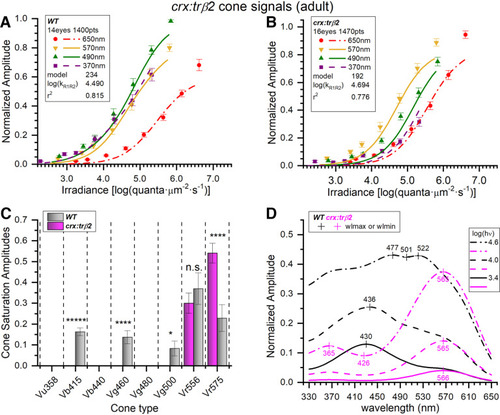
Adult crx:mYFP-2A-trβ2 transgenics are red-cone dichromats. A, Wild-type cone-PIII irradiance-response curves and datapoints at four stimulus wavelengths. The 370-, 490-, 570-, and 650-nm amplitudes are means (±SE) from the cumulative dataset (n = 20 except at 650 nm where n = 20 or 40). Curves are generated from the optimal model (#234) fit to a cumulative 1400 responses at seven irradiances for each of nine wavelengths as compiled from 20 spectral datasets acquired in 14 WT adult eyecups. B, The crx:trβ2 gain-of-function transgene causes irradiance-response points and model curves to bunch together as compared with WT. The model generating the curves (#192) is fit to 1470 cumulative responses compiled from 21 datasets acquired from 16 crx:trβ2 eyecups. The amplitudes (±SE) are means (370, 490, 570, and 650 nm, n = 21 except for 650 nm, n = 21 or 42). C, Signals from five blue, green, or red cone types were detected in WT adults (gray bars), but signals from only the two red-cone types were detected in crx:trβ2 eyecups (magenta bars). Fit values of cone saturation amplitudes (Vmi, Eq. 1; Fig. 2A) are plotted on a dataset-normalized scale (±SE). Except for Vr556 (LWS2) cone types differed significantly in amplitudes between WT and crx:trβ2 (asterisks, GraphPad Prism convention, n.s., not significant). Vb415 (B1, one-sample test): t(1373) = 8.77, p = 5.4 × 10⁻¹⁸; Vg460 (G1, one-sample test): t(1373) = 4.36, p = 1.4 × 10⁻⁵; Vg500 (G3, one-sample test): t(1373) = 2.30, p = 0.021; Vr556(R2): t(2818) = 0.782, p = 0.434; Vr575 (R1): t(2818) = 3.91, p = 9.2 × 10⁻⁵. D, Model spectral curves for adult WT (black) and crx:trβ2 (magenta) eyecups. The crx:trβ2 transgene shifts sensitivity peaks to long wavelengths at all stimulus irradiances. Curves are modeled for constant quantal stimuli at 3.4, 4.0, and 4.6 log(quanta·μm−2·s−1). A, B, The log(kR1R2) values are the irradiance semi-saturation values in log(quanta·μm−2·s−1) for both R1 and R2 cones. A–D, Eight- to 18-month adults, 10 mm aspartate medium. |
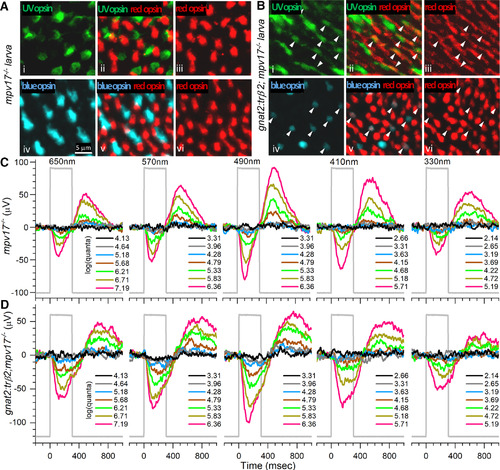
Juvenile cone distributions and spectral responses in gnat2:mYFP-2A-trβ2;mpv17−/− and mpv17−/− control retinas. Ai, UV opsin (SWS1) opsin immunoreactive cones in control (mpv17−/−) retina. Aiv, Blue-opsin (SWS2) immunoreactive cones in control retina. Aiii, Avi, Red (LWS1, LWS2) opsin immunoreactive cones in control retina. Aii, UV and red opsins are expressed in separate cones in control retina. Av, Blue and red opsins are expressed in separate cones in control retina. Bi, UV opsin immunoreactive cones in gnat2:trβ2 retina. Biv, Blue-opsin immunoreactive cones in gnat2:trβ2 retina. Biii, Bvi, Red-opsin immunoreactive cones in gnat2:trβ2 retina. Bii, Bv, Red opsins are expressed in some blue or UV opsin immunoreactive cones in a gnat2:trβ2 retina (arrowheads, Bi–Bvi). A, B, 12 dpf. C, D, Cone signals in mpv17−/− control and gnat2:trβ2 retinas are robust at all wavelengths, with greatest amplitudes at 490 nm and similar spectral patterns. The perfusion medium contains 20 mm aspartate to isolate cone signals. Stimulus irradiances [log(quanta·μm−2·s−1)] appear in the legends to the right of irradiance-response trace stacks; 6-dpf larvae. |
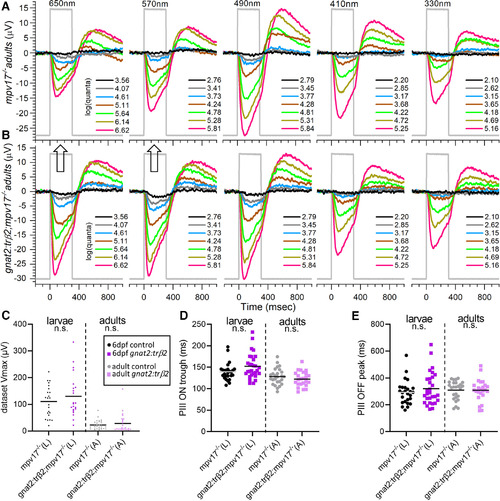
Adult cone PIII spectral properties in mpv17−/− and gnat2:mYFP-2A-trβ2;mpv17−/− retinas. A, Cone signals in an mpv17−/− control eyecup are evoked by all stimulus wavelengths and all but the dimmest irradiances (black traces). The largest amplitudes occur at 490 nm. B, Cone signals from a gnat2:trβ2 eyecup are stimulated by all wavelengths and irradiances. Greatest amplitudes occur at 650, 570, and 490 nm, with a larger amplitude spectral pattern at 650 and 570 nm than in the control (up arrows). A, B, Adults are 8–18 months. Eyecups are perfused with medium containing 10 mm aspartate to isolate retinal cone signals. Stimulus irradiances [log(quanta·μm−2·s−1)] appear in the legends to the right of irradiance-response waveform stacks. C, Voltage distributions of maximal trough-to-peak amplitudes found in spectral datasets. D, Cone-signal latencies from stimulus onset to the minimum in the ON trough. E, Cone-signal latency from stimulus offset to the OFF peak. C, D, E, The n.s. labels on all distributions indicate that that mpv17−/− controls did not significantly differ from gnat2:trβ2 transgenics in waveform characteristics (t test and p-values given in text). Peak amplitudes (dataset Vmax), trough (PIII ON trough), and peak (PIII OFF peak) latencies are measured on the mean waveforms from each 70-stimulus spectral dataset. |
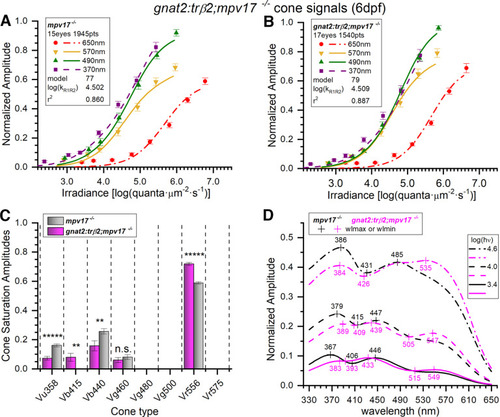
Embryonic spectral properties of cone signals from gnat2:mYFP-2A-trβ2;mpv17−/− and mpv17−/− control retinas. A, Control irradiance-response points and optimal model curves. The WT model (#77) was fit to 1945 spectral response amplitudes, combined from 28 datasets taken from 15 eyes. The points are subsets taken from the cumulative data. The 370-, 490-, and 570-nm amplitudes are means (±SE), n = 27 or 28; the 650 nm means, n = 28 or 56. B, The gnat2:trβ2 irradiance-response points and model curves at 370, 490, and 570 nm are more bunched together than in the control. The gnat2:trβ2 model (#79) was fit to 1540 spectral points, combined from 22 datasets taken from 17 eyes. The 370-, 490-, and 570-nm amplitudes are means (±SE), n = 22; 650 nm, n = 22 or 44. C, Four cone opsin types contributed significantly to cone-signals isolated from mpv17−/− control eyes (gray bars) but five types proved significant in gnat2:trβ2 eyes (magenta bars). Cone saturation amplitudes (Vmi, Eq. 1;Fig. 2A) are fractions of maximal dataset amplitudes (±SE). Asterisks represent the significance of amplitude differences between mpv17−/− control and gnat2:trβ2 (GraphPad Prism convention, n.s., not significant). Vu358 (UV): t(3422) = 5.37, p = 8.7 × 10⁻⁸; Vb415 (B1, one-sample test): t(1511) = 2.90, p = 0.0038; Vb440 (B2): t(3422) = 2.62, p = 0.0081; Vg460 (G1): t(3422) = 0.851, p = 0.395; Vr556 (R2): t(3422) = 9.94, p = 5.6 × 10⁻²³. D, Model spectral curves for mpv17−/− controls and gnat2:trβ2 retinas for constant quantal irradiances of 3.4, 4.0, and 4.6 log(quanta·μm−2·s−1). There is greater long-wavelength sensitivity, and lesser short-wavelength sensitivity in the embryonic gnat2:trβ2 gain-of-function transgenic, although the gains and deficits are much less severe than in the crx: trβ2 larvae. A, B, The log(kR1R2) values are the modeled R1-cone or R2-cone semi-saturation irradiances in log(quanta·μm−2·s−1). A–D, 6-dpf larvae, 20 mm aspartate medium. |
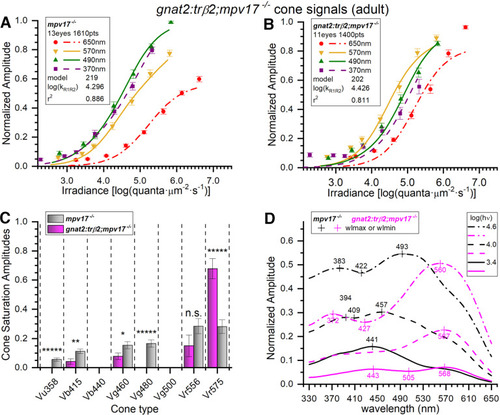
Adult spectral signals from gnat2:mYFP-2A-trβ2;mpv17−/− transgenics and mpv17−/− controls. A, Control (mpv17−/−) irradiance-response amplitudes and model curves at four wavelengths. The optimal model (#219) was fit to 1610 responses (all wavelengths) combined from 23 datasets taken from 13 eyecups. The 370-, 490-, and 570-nm amplitudes are means (±SE), n = 23; 650 nm, n = 23 or 46. B, Irradiance-response amplitudes, and model curves, for gnat2:trβ2. The transgene shifts 370- and 490-nm irradiance-response functions from the left of the 570-nm curve (control) to the right of the 570-nm curve (transgenic). The spectral algorithm was fit to 1400 points combined from 20 datasets accumulated from 11 eyecups. The 370-, 490-, and 570-nm amplitudes are means (±SE), n = 20; 650 nm, n = 20 or 40. C, In adult mpv17−/− control eyecups (gray bars), significant signals from six cone types were detected. Four were found in gnat2:trβ2 adults (magenta bars). Cone saturation amplitudes (Vmi, Eq. 1; Fig. 2A) are fractions of dataset maximum amplitudes (±SE). Asterisks (or n.s., not significant) represent the significance of differences between control and gnat2:trβ2 cone signals (GraphPad Prism convention). Vu358 (UV, one-sample test): t(1579) = 4.81, p = 1.7 × 10⁻⁶; Vb415 (B1): t(2983) = 2.97, p = 0.0030; Vg460 (G1): t(2983) = 2.26, p = 0.024; Vg480 (G3, one-sample test): t(1579) = 6.59, p = 6.1 × 10⁻¹¹; Vr556 (R2): t(2983) = 1.52, p = 0.127; Vr575 (R1): t(2983) = 4.87, p = 1.2 × 10⁻⁶. D, Adult spectral curves for mpv17−/− control and gnat2:trβ2 retinas. The transgene shifts sensitivity peaks to long wavelengths for all constant-quantal irradiances [3.4, 4.0, and 4.6 log(quanta·μm−2·s−1)]. A, B, The log(kR1R2) values are R1 or R2 cone semi-saturation irradiances in log(quanta·μm−2·s−1). A–D, Eight- to 18-month adults, 10 mm aspartate medium. |
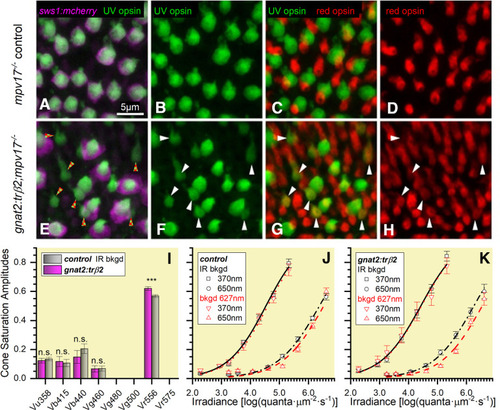
The UV-opsin reporter is inactive in embryonic cones co-expressing UV and red opsins, but these red opsins produce no UV-desensitizing signal. A, UV-opsin (SWS1) immunoreactivity (green) and florescence of a reporter transgene for sws1 (sws1:nfsBmCherry, magenta) colocalize in mpv17−/− control UV cones. B, UV-opsin immunoreactivity in control retina. C, In the control retina UV-opsin (green) and red-opsin (red) immunoreactivity localize in separate cones. D, Red-opsin immunoreactivity in the control retina. E, In gnat2:trβ2 cones, UV-opsin immunoreactivity (green) is always found when there is sws1 reporter gene fluorescence (sws1:nfsBmCherry, magenta), but not all UV-opsin immunoreactive cones show reporter-gene fluorescence (red and green checkered arrowheads). F, UV-opsin immunoreactive cones in the gnat2:trβ2 retina. G, Co-expression of UV-opsin (green) and red-opsin (red) immunoreactivity in gnat2:trβ2 cones. White arrowheads (F, G, H) point to cones expressing both UV opsin (green) and red opsin (red). The dual opsin cones are the UV-opsin immunoreactive cones in E, that lack sws1 reporter fluorescence (red and green checkered arrowheads). H, Red-opsin immunoreactive cones in gnat2:trβ2 retina. I, Saturation amplitudes (Vmi ± SE) of signals from five cone types in control (gray) and gnat2:trβ2 (magenta) eyes. Control: Spectral algorithm fit to 1890 datapoints from 27 datasets recorded in 15 eyes; gnat2:trβ2, 1260 datapoints from 18 datasets recorded in 11 eyes. In each case, the optimal fit was model 79. Asterisks give significance of differences (two sample t tests, n.s., not significant) in cone-signal amplitudes (Vu358: t(3091) = 0.56, p = 0.57; Vb415: t(3091) = 0.25, p = 0.81; Vb440: t(3091) = 1.05, p = 0.29; Vg460: t(3091) = 0.084, p = 0.93; Vr556, t(3091) = 3.39, p = 0.0007). J, Control strain (mpv17−/−) irradiance-response curves at 370 and 650 nm in the presence of infrared (IR; black) or 627-nm (red) backgrounds (bkgd). Points are means ± SE (370-nm stimulus: IR background, n = 27; red background, n = 15; 650-nm stimulus: IR background, n = 54 or 27; red background, n = 30 or 15). K, gnat2:trβ2 irradiance-response curves at 370 and 650 nm in the presence of IR (black) or red backgrounds. Points are means ± SE (370-nm stimulus: IR background, n = 18; red background, n = 12; 650-nm stimulus: IR background, n = 18 or 36; red background, n = 12 or 24). J, K, Hill function curves fit at each background and wavelength are constrained to have equal maximal amplitudes and exponents. Cone-PIII ERG signals isolated with 20 mm aspartate. A–K, Eyes and retinas are from 5-dpf embryos. |
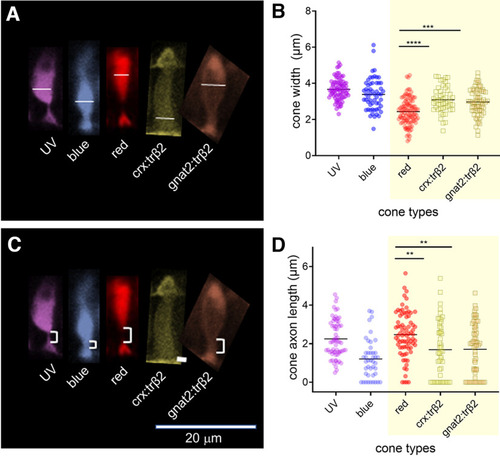
Thyroxin-receptor-β2 gain-of-function transgenes alter cone morphology. A, Width of cone types identified by transgene markers, is measured at the greatest extent of the inner segment. B, The trβ2 gain-of function cones are significantly wider than red-cones. C, The cone axon length is measured from the base of the inner segment to the apex of the cone pedicle. D, The trβ2 gain-of-function axon lengths are significantly shorter than red-cone axon lengths. B, D, Asterisks indicate significant differences (GraphPad convention, ANOVA and Tukey post hoc p-values given in text). A, C, Images are of 6-dpf in vivo larval fluorescent cones from confocal stacks. Control UV and red cones were imaged in sws1:GFP;trβ2:tdTomato larvae; blue cones, in sws2:GFP larvae; fluorescent trβ2 gain-of-function cones, in crx:mYFP-2A-trβ2 and gnat2:mYFP-2A-trβ2;mpv17−/− larvae. Larvae were anesthetized with MS222 and embedded in agarose after raising to 6 dpf in 300 μm PTU to block melanin formation in the pigment epithelium. |
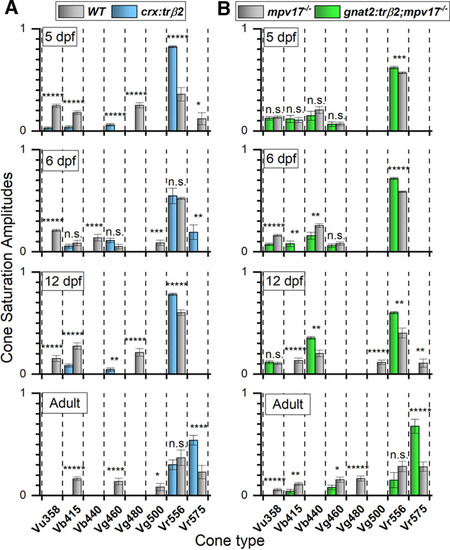
Signal development in red, green, blue, and UV cones. A, In crx:mYFP-2A-trβ2 eyes, red-cone signals (Vr575, Vr556) are larger than WT from 5-dpf embryos to adults while blue-cone, green-cone, and UV-cone signals (Vb415, Vb440; Vg460, Vg480, Vg500; Vu360) are smaller, and disappear in adults. B, In 5-dpf embryonic gnat2:mYFP-2A-trβ2;mpv17−/− eyes, the overall signal amplitudes of red (Vr575, Vr556), green (Vg460, Vg480, Vg500), blue (Vb415, Vb440), and UV (Vu358) cones are indistinguishable from mpv17−/− controls (ANOVA in text), but later in development red-cone amplitudes increase while green-cone, blue-cone, and UV-cone signals decrease. A, B, In adults of both transgenics, the largest signal is Vr575, coming from LWS1 cones, while controls show lesser Vr575 amplitudes. “5 dpf” and “6 dpf” are larval or embryonic stages. “12 dpf” is an early juvenile stage, and “Adults” are 8–18 months. In each bar chart, spectral datasets from multiple eyes are combined and fit by the Equation 1 (Fig. 1) algorithm to identify the most likely contributing cone types and their saturation voltages. A cone signal detected only in one of the two strains is evaluated by a one-sample t test and a cone detected in both strains by a two-sample t test. Asterisks denote significance (GraphPad convention, n.s., not significant). A, 5 dpf, 7 WT eyes, 11 crx:trβ2 eyes: Vu358 (UV), t(2465) = 10.4, p = 5.8 × 10⁻²⁵; Vb415 (B1), t(2465) = 5.74, p = 1.1 × 10⁻⁸; Vg460 (G1), t(1638) = 4.54, p = 6.0 × 10⁻⁶; Vg480 (G3), t(827) = 10.3, p = 1.6 × 10⁻²³; Vr556 (R2), t(2465) = 9.51, p = 4.3 × 10⁻²¹; Vr575 (R1), t(827) = 2.02, p = 0.043. 6 dpf, 10 WT eyes, 11 crx:trβ2 eyes: t tests given in Figure 5. 12 dpf, 3 WT eyes, 6 crx:trβ2 eyes. Vu358 (UV), t(243) = 5.12, p = 6.2 × 10⁻⁷; Vb415 (B1), t(1558) = 4.86, p = 1.3 × 10⁻⁶; Vg460 (G1), t(1315) = 2.86, p = 0.00435; Vg480 (G3), t(243) = 5.61, p = 5.5 × 10⁻⁸; Vr556 (R2), t(1558) = 6.30, 3.90 × 10⁻¹⁰. Adult, 14 WT eyes, 16 crx:trβ2 eyes: t tests given in Figure 6. B, 5 dpf, 15 mpv17−/− eyes, 11 gnat2:trβ2;mpv17−/− eyes: t tests given in Figure 11. 6 dpf, 15 mpv17−/− eyes; 17 gnat2:trβ2; mpv17−/− eyes: t tests given in Figure 9. 12 dpf, 16 mpv17−/− eyes; 9 gnat2:trβ2;mpv17−/− eyes: Vu358 (UV), t(2540) = 0.59, p = 0.55; Vb415 (B1), t(1786) = 5.31, p = 1.2 × 10⁻⁷; Vg440 (B2), t(2540) = 3.04, p = 0.0023; Vg500 (G4), t(1786) = 5.22, p = 2.0 × 10⁻⁷; Vr556 (R2), t(2540) = 2.65, p = 0.00815; Vr575 (R1), t(1786) = 2.66, p = 0.0079. Adult, 13 mpv17−/− eyes; 11 gnat2:trβ2;mpv17−/− eyes: t tests given in Figure 10. A, B, Fit values of Vmi cone saturation voltages ± SE. |