
|
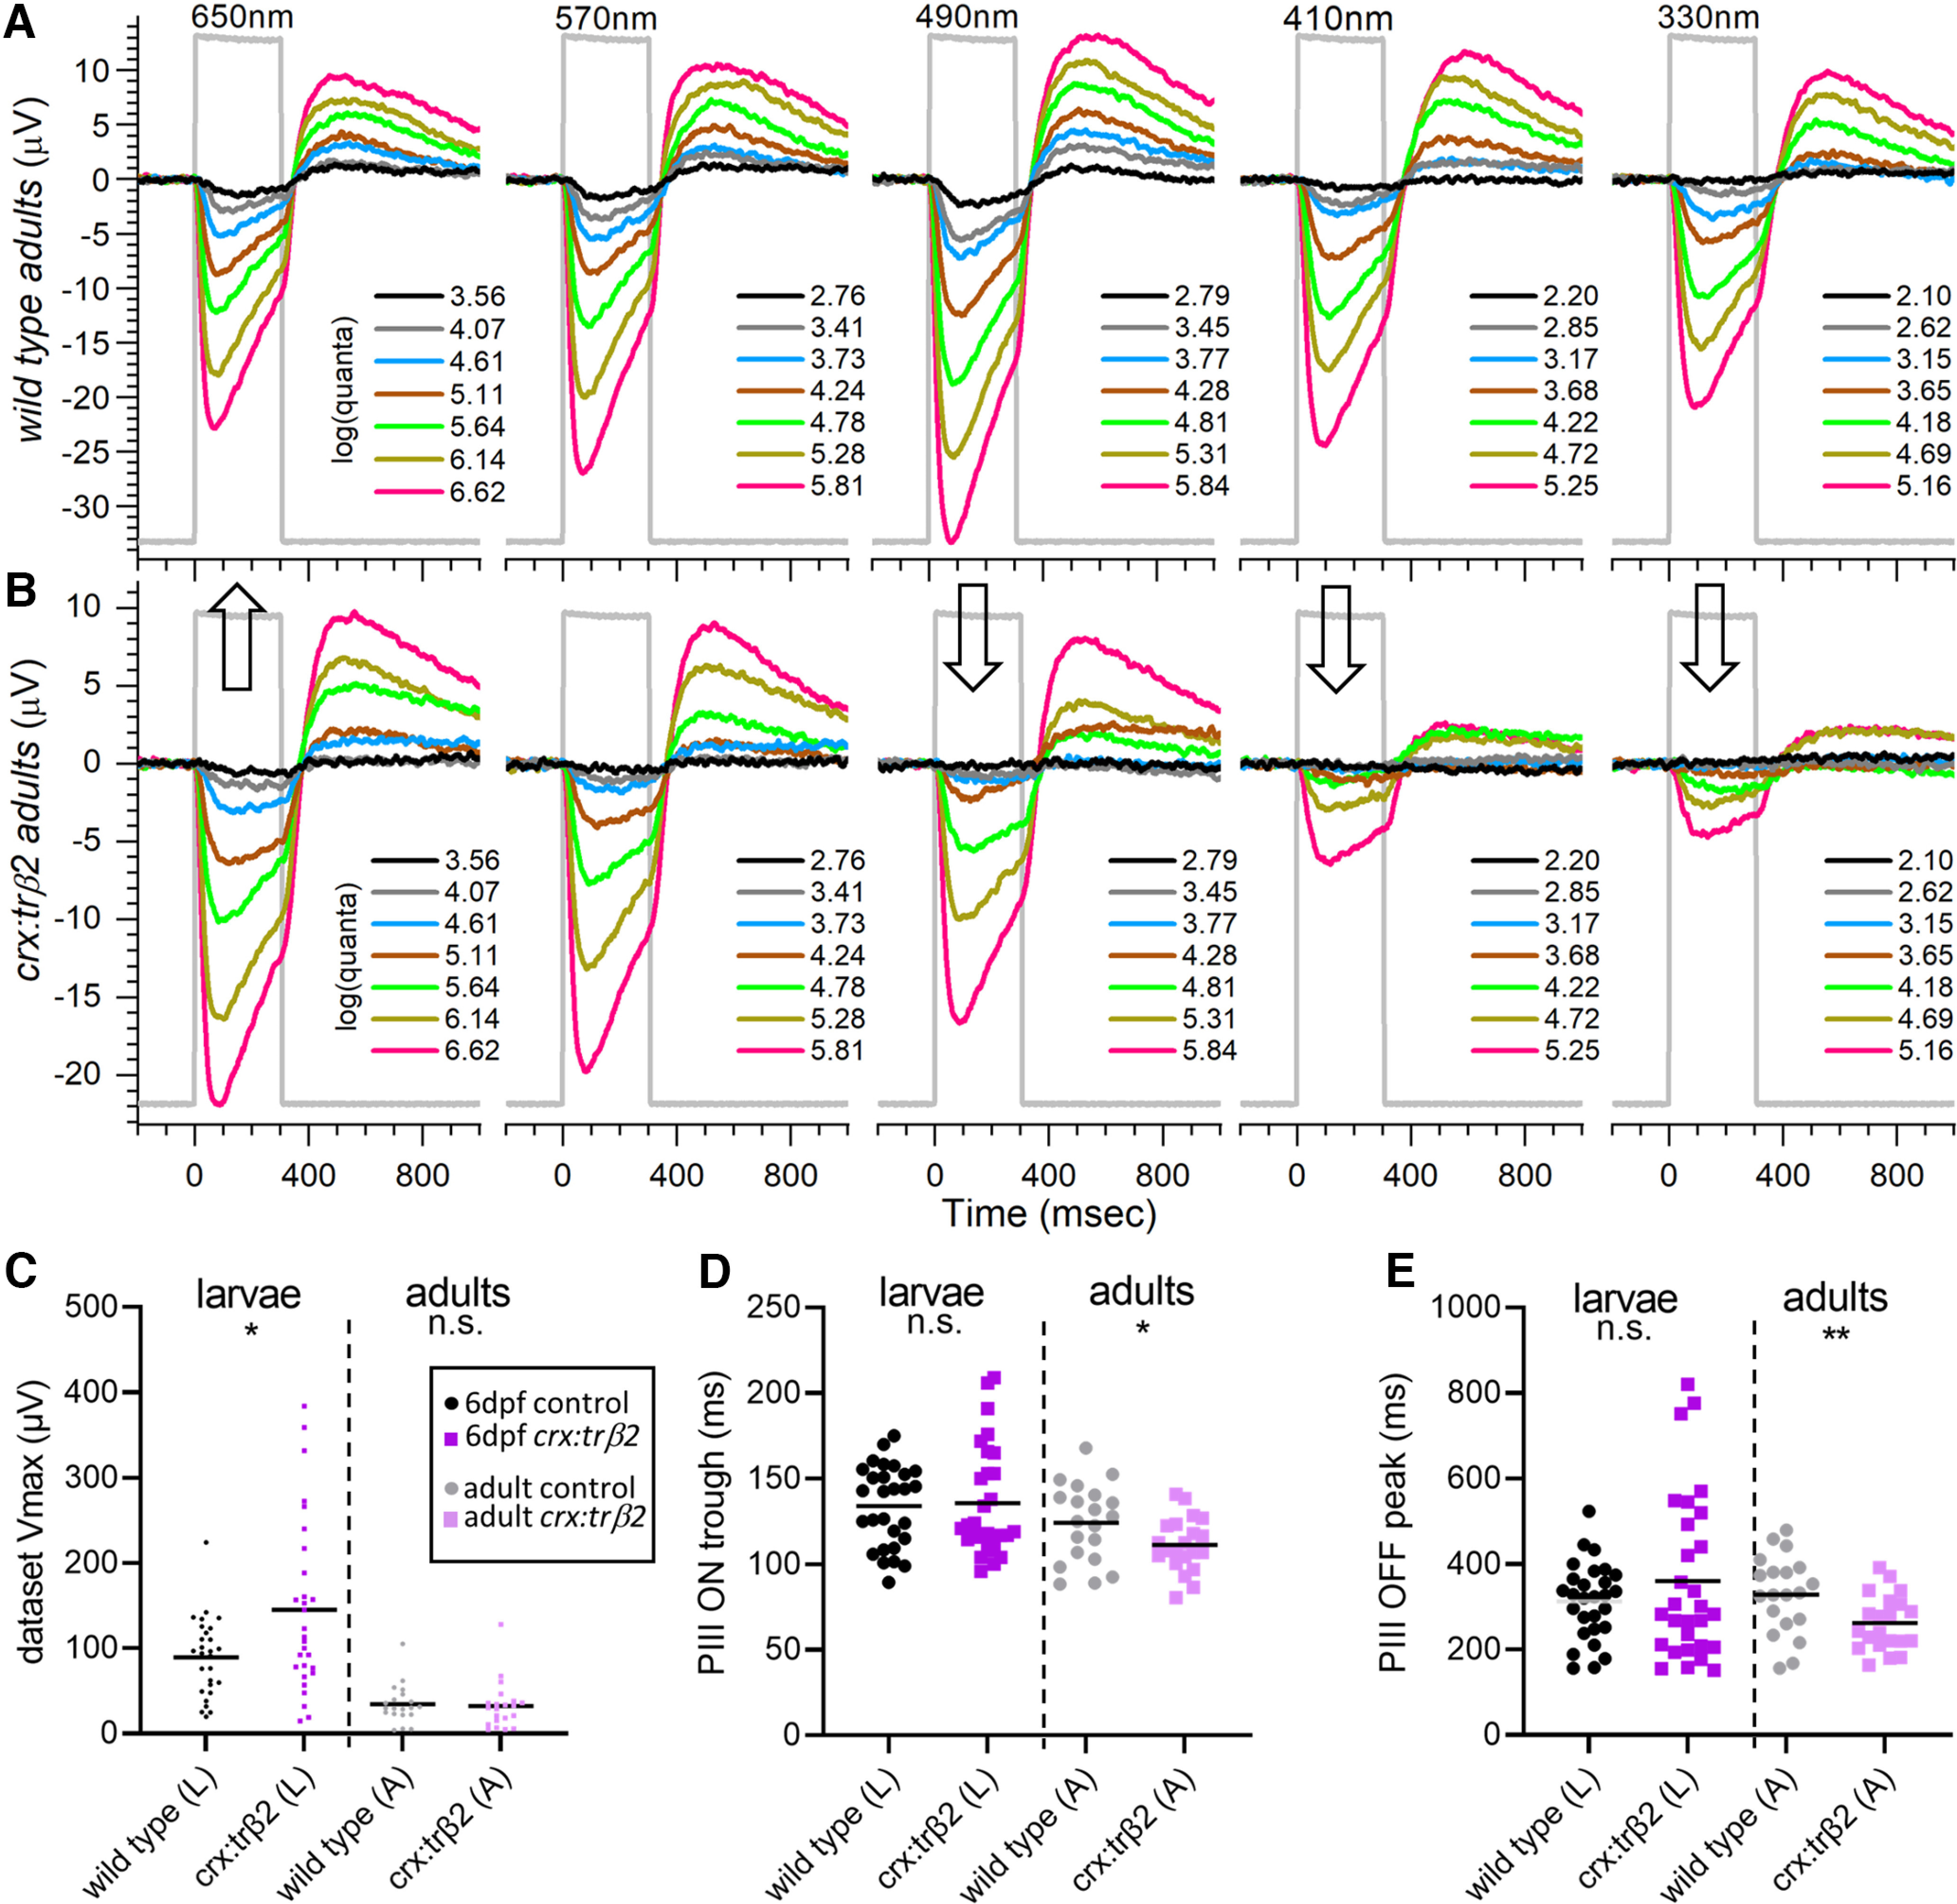
Figure 4.
Adult cone spectral signals in WT and crx:mYFP-2A-trβ2 retinas. A, In WT eyecups, all wavelengths and most irradiances evoke signals, with a maximal response at 490 nm. B, Cone signals from crx:trβ2 eyecups are maximal at 650 nm, where they are relatively greater than WT (up arrow). Response amplitudes to wavelengths that stimulate blue and UV cones (330, 410, and 330 nm) are relatively less than WT (down arrows). In A and B, adults are 8–18 months. The perfusion medium contains 10 mm aspartate to isolate photoreceptor signals. The nested responses are irradiance-response series at each wavelength, with irradiances given in legends to the right of the traces in units of log(quanta·μm−2·s−1). C–E, Properties of ERG cone-PIII waveforms in larval and adult, WT and crx:trβ2 retinas. C, Distributions of maximal trough-to-peak amplitudes in larval and adult spectral datasets. D, Cone-signal latency from stimulus onset to the minimum of the ON trough of the cone signal are measured on the mean responses of each 280-stimulus spectral dataset. E, Cone-signal latency to the OFF peak in the mean responses of spectral datasets. OFF latencies are measured from stimulus offset. Asterisks (n.s., not significant) are probabilities that WT and crx:trβ2 distributions differ in larvae or adults (GraphPad Prism convention, statistics given in text).