
Figure 13.
- ID
- ZDB-FIG-221211-321
- Publication
- Nelson et al., 2022 - The developmental progression of eight opsin spectral signals recorded from the zebrafish retinal cone layer is altered by the timing and cell type expression of thyroxin receptor β2 (trβ2) gain-of-function transgenes
- Other Figures
- All Figure Page
- Back to All Figure Page
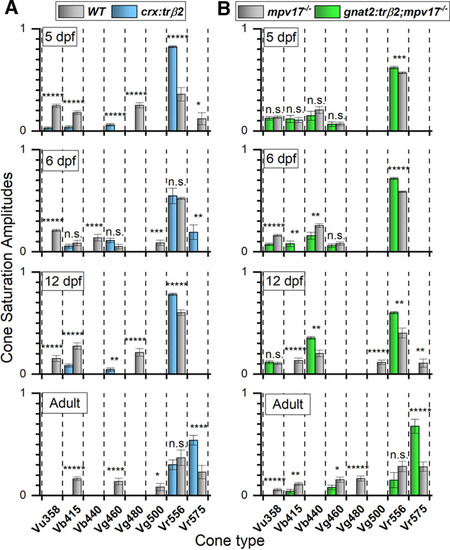
Signal development in red, green, blue, and UV cones. A, In crx:mYFP-2A-trβ2 eyes, red-cone signals (Vr575, Vr556) are larger than WT from 5-dpf embryos to adults while blue-cone, green-cone, and UV-cone signals (Vb415, Vb440; Vg460, Vg480, Vg500; Vu360) are smaller, and disappear in adults. B, In 5-dpf embryonic gnat2:mYFP-2A-trβ2;mpv17−/− eyes, the overall signal amplitudes of red (Vr575, Vr556), green (Vg460, Vg480, Vg500), blue (Vb415, Vb440), and UV (Vu358) cones are indistinguishable from mpv17−/− controls (ANOVA in text), but later in development red-cone amplitudes increase while green-cone, blue-cone, and UV-cone signals decrease. A, B, In adults of both transgenics, the largest signal is Vr575, coming from LWS1 cones, while controls show lesser Vr575 amplitudes. “5 dpf” and “6 dpf” are larval or embryonic stages. “12 dpf” is an early juvenile stage, and “Adults” are 8–18 months. In each bar chart, spectral datasets from multiple eyes are combined and fit by the Equation 1 (Fig. 1) algorithm to identify the most likely contributing cone types and their saturation voltages. A cone signal detected only in one of the two strains is evaluated by a one-sample t test and a cone detected in both strains by a two-sample t test. Asterisks denote significance (GraphPad convention, n.s., not significant). A, 5 dpf, 7 WT eyes, 11 crx:trβ2 eyes: Vu358 (UV), t(2465) = 10.4, p = 5.8 × 10⁻²⁵; Vb415 (B1), t(2465) = 5.74, p = 1.1 × 10⁻⁸; Vg460 (G1), t(1638) = 4.54, p = 6.0 × 10⁻⁶; Vg480 (G3), t(827) = 10.3, p = 1.6 × 10⁻²³; Vr556 (R2), t(2465) = 9.51, p = 4.3 × 10⁻²¹; Vr575 (R1), t(827) = 2.02, p = 0.043. 6 dpf, 10 WT eyes, 11 crx:trβ2 eyes: t tests given in Figure 5. 12 dpf, 3 WT eyes, 6 crx:trβ2 eyes. Vu358 (UV), t(243) = 5.12, p = 6.2 × 10⁻⁷; Vb415 (B1), t(1558) = 4.86, p = 1.3 × 10⁻⁶; Vg460 (G1), t(1315) = 2.86, p = 0.00435; Vg480 (G3), t(243) = 5.61, p = 5.5 × 10⁻⁸; Vr556 (R2), t(1558) = 6.30, 3.90 × 10⁻¹⁰. Adult, 14 WT eyes, 16 crx:trβ2 eyes: t tests given in Figure 6. B, 5 dpf, 15 mpv17−/− eyes, 11 gnat2:trβ2;mpv17−/− eyes: t tests given in Figure 11. 6 dpf, 15 mpv17−/− eyes; 17 gnat2:trβ2; mpv17−/− eyes: t tests given in Figure 9. 12 dpf, 16 mpv17−/− eyes; 9 gnat2:trβ2;mpv17−/− eyes: Vu358 (UV), t(2540) = 0.59, p = 0.55; Vb415 (B1), t(1786) = 5.31, p = 1.2 × 10⁻⁷; Vg440 (B2), t(2540) = 3.04, p = 0.0023; Vg500 (G4), t(1786) = 5.22, p = 2.0 × 10⁻⁷; Vr556 (R2), t(2540) = 2.65, p = 0.00815; Vr575 (R1), t(1786) = 2.66, p = 0.0079. Adult, 13 mpv17−/− eyes; 11 gnat2:trβ2;mpv17−/− eyes: t tests given in Figure 10. A, B, Fit values of Vmi cone saturation voltages ± SE. |