
Figure 9.
- ID
- ZDB-FIG-221211-317
- Publication
- Nelson et al., 2022 - The developmental progression of eight opsin spectral signals recorded from the zebrafish retinal cone layer is altered by the timing and cell type expression of thyroxin receptor β2 (trβ2) gain-of-function transgenes
- Other Figures
- All Figure Page
- Back to All Figure Page
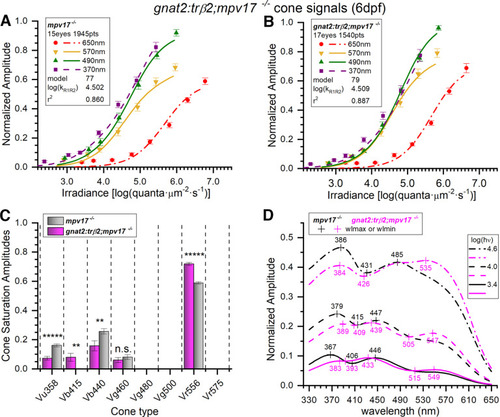
Embryonic spectral properties of cone signals from gnat2:mYFP-2A-trβ2;mpv17−/− and mpv17−/− control retinas. A, Control irradiance-response points and optimal model curves. The WT model (#77) was fit to 1945 spectral response amplitudes, combined from 28 datasets taken from 15 eyes. The points are subsets taken from the cumulative data. The 370-, 490-, and 570-nm amplitudes are means (±SE), n = 27 or 28; the 650 nm means, n = 28 or 56. B, The gnat2:trβ2 irradiance-response points and model curves at 370, 490, and 570 nm are more bunched together than in the control. The gnat2:trβ2 model (#79) was fit to 1540 spectral points, combined from 22 datasets taken from 17 eyes. The 370-, 490-, and 570-nm amplitudes are means (±SE), n = 22; 650 nm, n = 22 or 44. C, Four cone opsin types contributed significantly to cone-signals isolated from mpv17−/− control eyes (gray bars) but five types proved significant in gnat2:trβ2 eyes (magenta bars). Cone saturation amplitudes (Vmi, Eq. 1;Fig. 2A) are fractions of maximal dataset amplitudes (±SE). Asterisks represent the significance of amplitude differences between mpv17−/− control and gnat2:trβ2 (GraphPad Prism convention, n.s., not significant). Vu358 (UV): t(3422) = 5.37, p = 8.7 × 10⁻⁸; Vb415 (B1, one-sample test): t(1511) = 2.90, p = 0.0038; Vb440 (B2): t(3422) = 2.62, p = 0.0081; Vg460 (G1): t(3422) = 0.851, p = 0.395; Vr556 (R2): t(3422) = 9.94, p = 5.6 × 10⁻²³. D, Model spectral curves for mpv17−/− controls and gnat2:trβ2 retinas for constant quantal irradiances of 3.4, 4.0, and 4.6 log(quanta·μm−2·s−1). There is greater long-wavelength sensitivity, and lesser short-wavelength sensitivity in the embryonic gnat2:trβ2 gain-of-function transgenic, although the gains and deficits are much less severe than in the crx: trβ2 larvae. A, B, The log(kR1R2) values are the modeled R1-cone or R2-cone semi-saturation irradiances in log(quanta·μm−2·s−1). A–D, 6-dpf larvae, 20 mm aspartate medium. |