
|
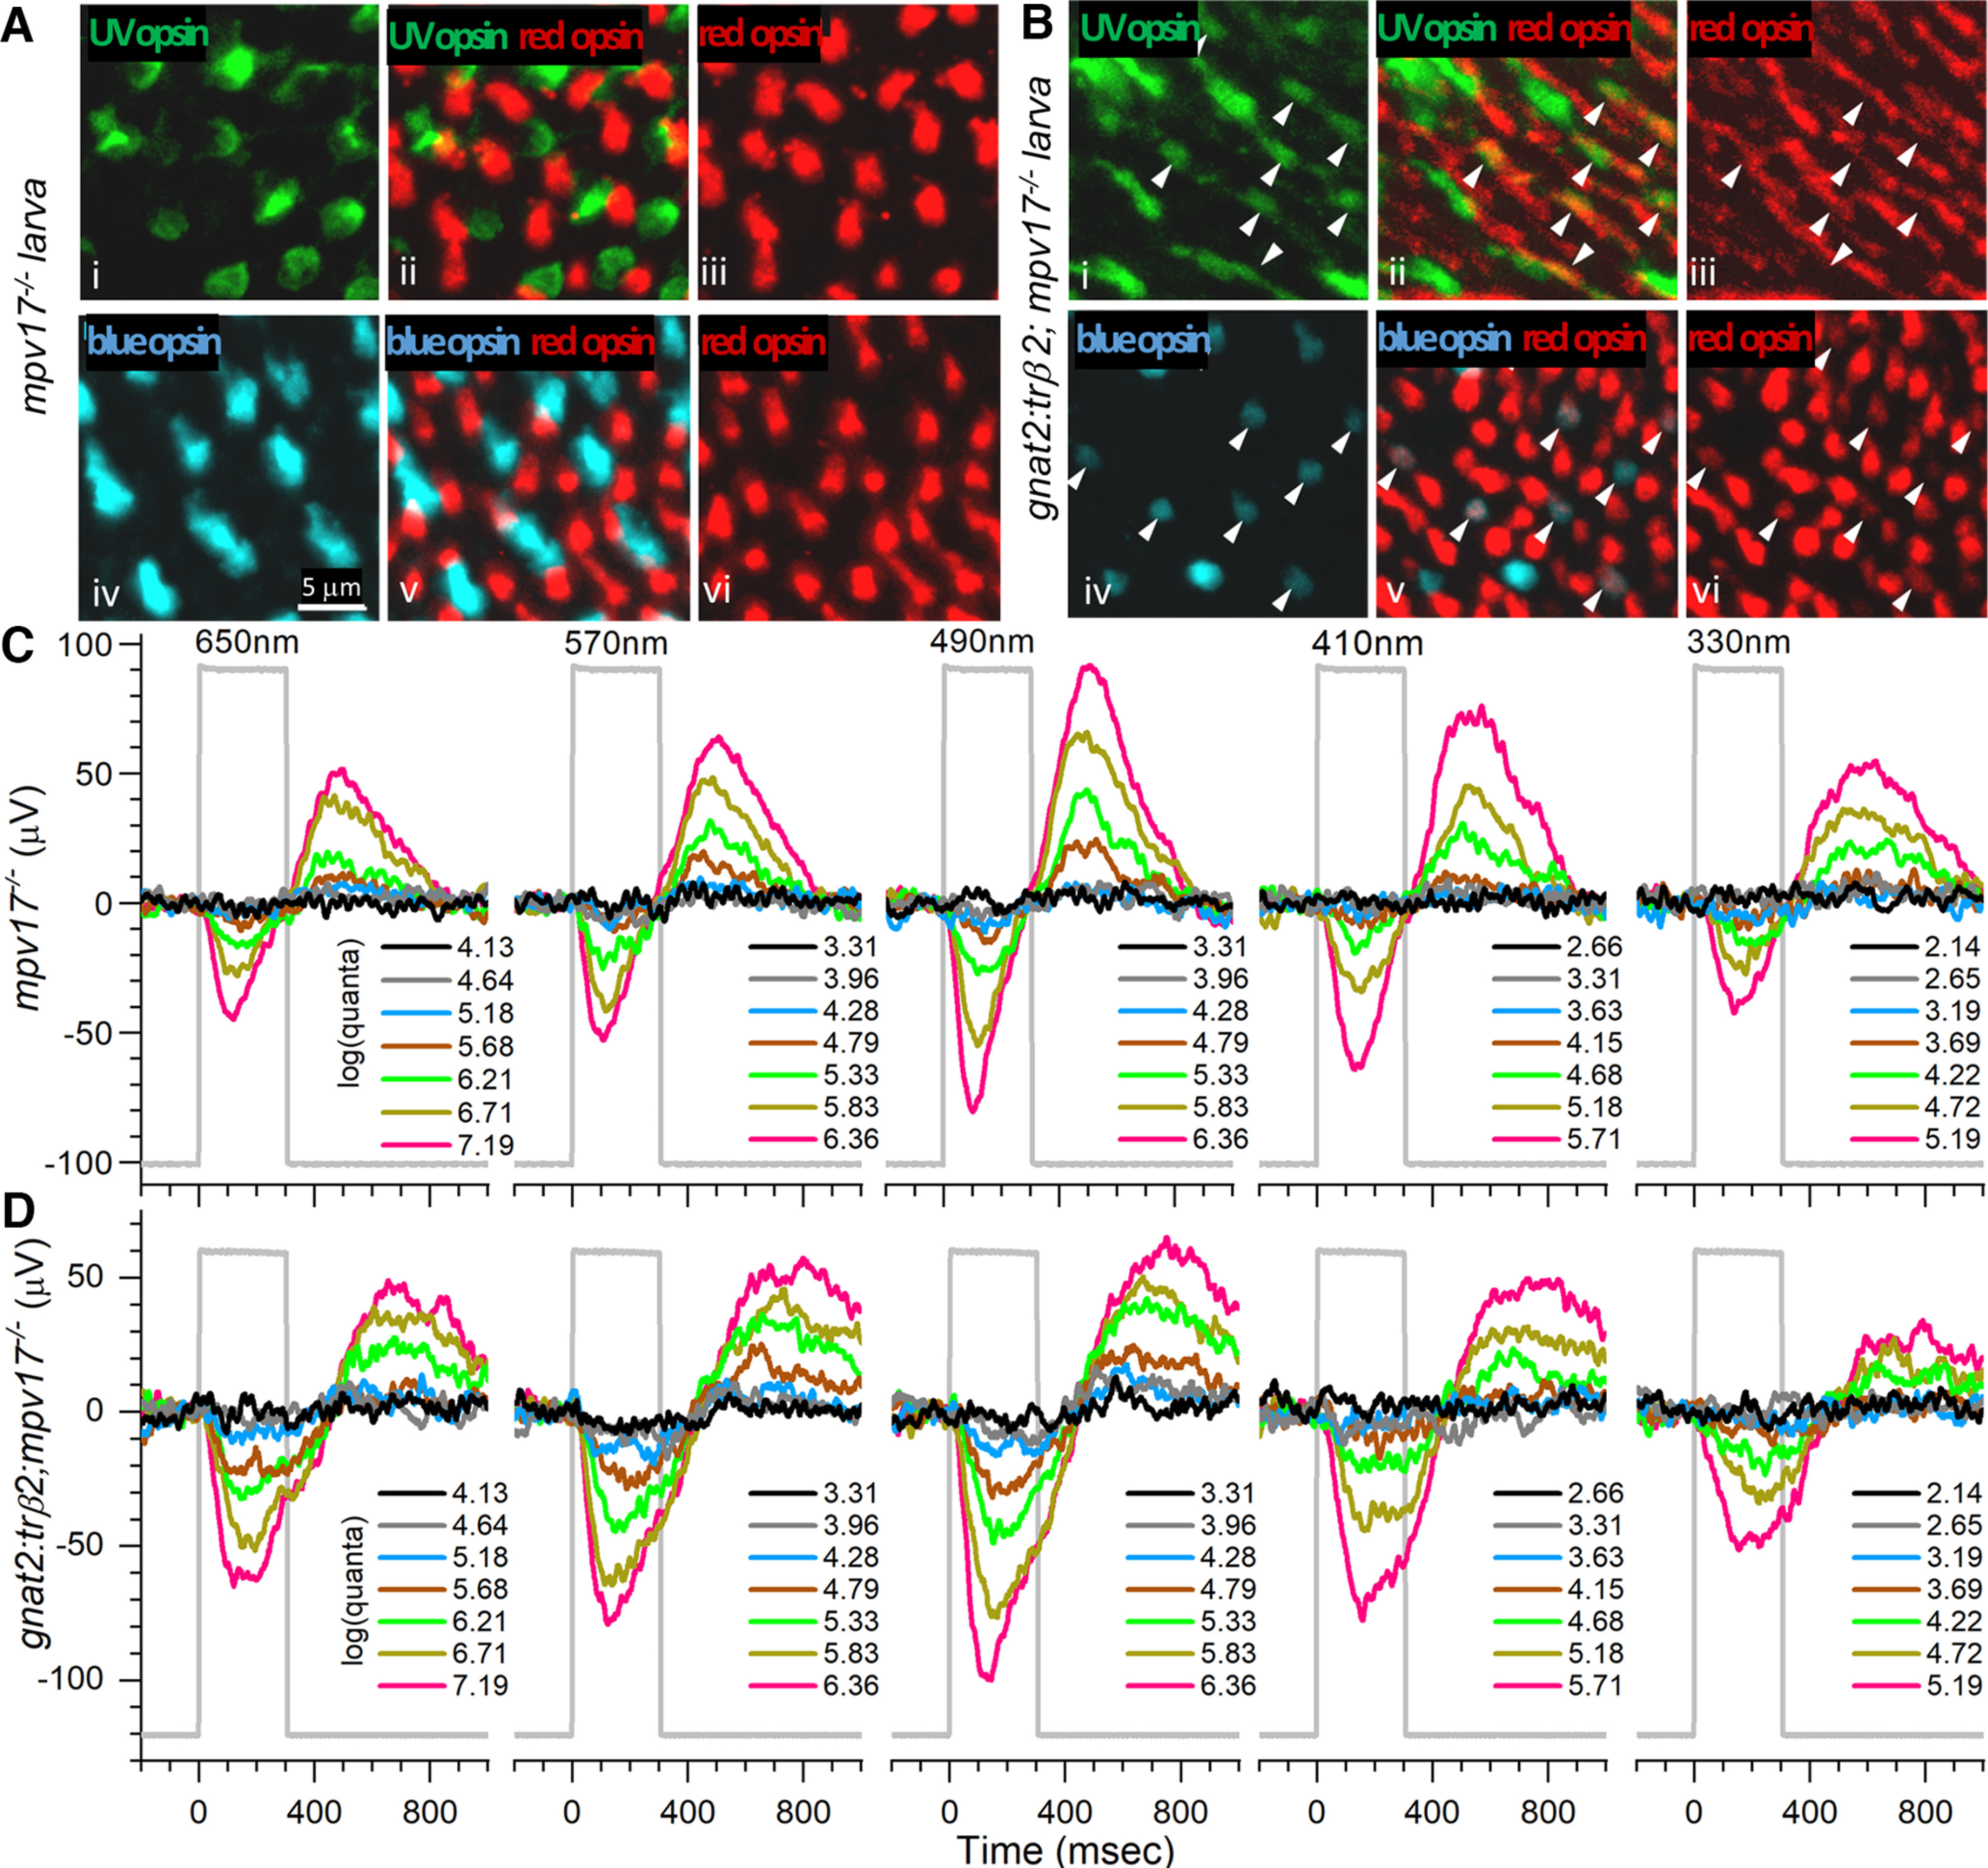
Figure 7.
Juvenile cone distributions and spectral responses in gnat2:mYFP-2A-trβ2;mpv17−/− and mpv17−/− control retinas. Ai, UV opsin (SWS1) opsin immunoreactive cones in control (mpv17−/−) retina. Aiv, Blue-opsin (SWS2) immunoreactive cones in control retina. Aiii, Avi, Red (LWS1, LWS2) opsin immunoreactive cones in control retina. Aii, UV and red opsins are expressed in separate cones in control retina. Av, Blue and red opsins are expressed in separate cones in control retina. Bi, UV opsin immunoreactive cones in gnat2:trβ2 retina. Biv, Blue-opsin immunoreactive cones in gnat2:trβ2 retina. Biii, Bvi, Red-opsin immunoreactive cones in gnat2:trβ2 retina. Bii, Bv, Red opsins are expressed in some blue or UV opsin immunoreactive cones in a gnat2:trβ2 retina (arrowheads, Bi–Bvi). A, B, 12 dpf. C, D, Cone signals in mpv17−/− control and gnat2:trβ2 retinas are robust at all wavelengths, with greatest amplitudes at 490 nm and similar spectral patterns. The perfusion medium contains 20 mm aspartate to isolate cone signals. Stimulus irradiances [log(quanta·μm−2·s−1)] appear in the legends to the right of irradiance-response trace stacks; 6-dpf larvae.