
Figure 10.
- ID
- ZDB-FIG-221211-318
- Publication
- Nelson et al., 2022 - The developmental progression of eight opsin spectral signals recorded from the zebrafish retinal cone layer is altered by the timing and cell type expression of thyroxin receptor β2 (trβ2) gain-of-function transgenes
- Other Figures
- All Figure Page
- Back to All Figure Page
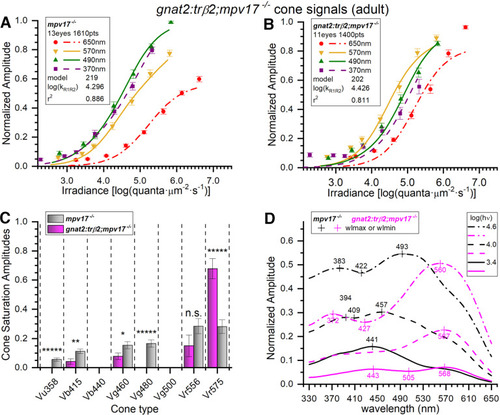
Adult spectral signals from gnat2:mYFP-2A-trβ2;mpv17−/− transgenics and mpv17−/− controls. A, Control (mpv17−/−) irradiance-response amplitudes and model curves at four wavelengths. The optimal model (#219) was fit to 1610 responses (all wavelengths) combined from 23 datasets taken from 13 eyecups. The 370-, 490-, and 570-nm amplitudes are means (±SE), n = 23; 650 nm, n = 23 or 46. B, Irradiance-response amplitudes, and model curves, for gnat2:trβ2. The transgene shifts 370- and 490-nm irradiance-response functions from the left of the 570-nm curve (control) to the right of the 570-nm curve (transgenic). The spectral algorithm was fit to 1400 points combined from 20 datasets accumulated from 11 eyecups. The 370-, 490-, and 570-nm amplitudes are means (±SE), n = 20; 650 nm, n = 20 or 40. C, In adult mpv17−/− control eyecups (gray bars), significant signals from six cone types were detected. Four were found in gnat2:trβ2 adults (magenta bars). Cone saturation amplitudes (Vmi, Eq. 1; Fig. 2A) are fractions of dataset maximum amplitudes (±SE). Asterisks (or n.s., not significant) represent the significance of differences between control and gnat2:trβ2 cone signals (GraphPad Prism convention). Vu358 (UV, one-sample test): t(1579) = 4.81, p = 1.7 × 10⁻⁶; Vb415 (B1): t(2983) = 2.97, p = 0.0030; Vg460 (G1): t(2983) = 2.26, p = 0.024; Vg480 (G3, one-sample test): t(1579) = 6.59, p = 6.1 × 10⁻¹¹; Vr556 (R2): t(2983) = 1.52, p = 0.127; Vr575 (R1): t(2983) = 4.87, p = 1.2 × 10⁻⁶. D, Adult spectral curves for mpv17−/− control and gnat2:trβ2 retinas. The transgene shifts sensitivity peaks to long wavelengths for all constant-quantal irradiances [3.4, 4.0, and 4.6 log(quanta·μm−2·s−1)]. A, B, The log(kR1R2) values are R1 or R2 cone semi-saturation irradiances in log(quanta·μm−2·s−1). A–D, Eight- to 18-month adults, 10 mm aspartate medium. |