
Figure 5.
- ID
- ZDB-FIG-221211-313
- Publication
- Nelson et al., 2022 - The developmental progression of eight opsin spectral signals recorded from the zebrafish retinal cone layer is altered by the timing and cell type expression of thyroxin receptor β2 (trβ2) gain-of-function transgenes
- Other Figures
- All Figure Page
- Back to All Figure Page
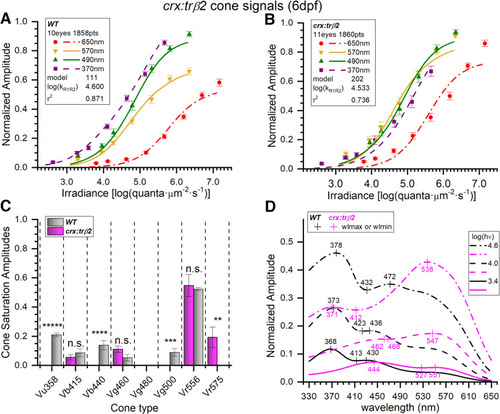
Spectral models of cumulative data from 6-dpf embryonic crx:mYFP-2A-trβ2 and wild-type eyes. A, WT irradiance-response datapoints, SEs, and optimal model (#111) curves as fit to 1858 spectral response amplitudes combined from 28 normalized datasets taken from 10 eyes (Fig. 1A, Eq. 1 algorithm); 370 nm, n = 23–28; 490 nm, n = 27–28; 570 nm; n = 23–28; 650 nm, n = 23–55. B, crx:trβ2 irradiance-response datapoints and optimal model (#202) curves fit to 1860 spectral points combined from 29 datasets taken from 11 eyes. Individual points: 370 nm, n = 22–28; 490 nm, n = 23–28; 570 nm, n = 27–28; 650 nm, n = 24–55. The crx:trβ2 transgene moves curves and points along the irradiance axis as compared with WT. C, In WT, six cone opsin types (gray bars) were detected by the optimal model. In crx:trβ2, four cone opsin signals were detected (magenta bars). Cone saturation amplitudes [Vmi values (Eq. 1; Fig. 2A) ± SE] are fractions of dataset maximal amplitudes. Asterisks denote significance of differences between WT and crx:trβ2 (one-sample or two-sample t tests; n.s., not significant; GraphPad Prism convention). Vu358 (UV, one-sample test): t(1822) = 17.8, p = 1.2 × 10−65; Vb415 (B1): t(3647) = 0.958, p = 0.338; Vb440 (B2): t(1822) = 4.27, p = 2.0 × 10⁻⁵; Vg460 (G1): t(3647) = 1.87, p =0.062; Vg500 (G4, one-sample test): t(1822) = 3.33, p = 8.8 × 10⁻⁴; Vr556 (R2): t(3647) = 0.318, p = 0.751; Vr575 (R1): t(1825) = 2.72, p = 0.0067. D, Spectral peaks shift to longer wavelengths for crx:trβ2 (magenta) as compared with WT (black). Spectral curves are the modeled amplitudes that would be evoked by three different irradiances of constant quantal stimulation across the spectrum [3.4, 4.0, and 4.6 log(quanta·μm−2·s−1)]. Spectral shapes differ with stimulus brightness. A, B, The log(kR1R2) values are modeled R1-cone and R2-cone semi-saturation irradiances in log(quanta·μm−2·s−1). A–D, 20 mm aspartate medium. |