FIGURE

Figure 2.

ID
ZDB-FIG-221211-310
Publication
Nelson et al., 2022 - The developmental progression of eight opsin spectral signals recorded from the zebrafish retinal cone layer is altered by the timing and cell type expression of thyroxin receptor β2 (trβ2) gain-of-function transgenes
Other Figures
All Figure Page
Back to All Figure Page
Figure 2.

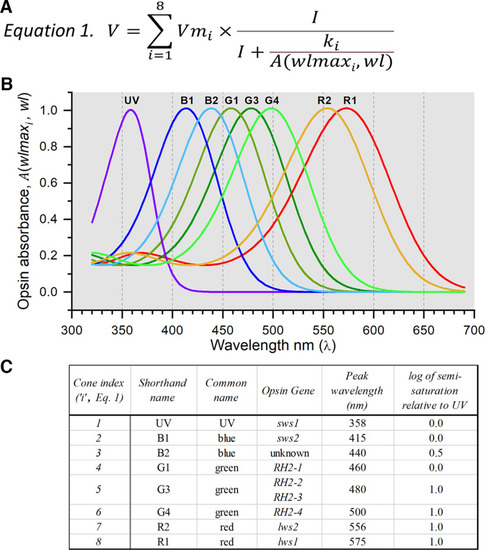
Algorithm for determining the signal strengths of the different cone types contributing to ERG spectral data. A, Equation 1. Aspartate-isolated cone signals from zebrafish eyes are a summation of signals from eight cone types, each distinguished by different maximal amplitudes (Vmi), semi-saturation irradiances (ki), and opsin peak absorbances (wlmaxi). There are 255 unique combinations of eight cones, each combination is a candidate to best model cone spectral responses in the ERG. B, Spectral shapes of opsin absorbances [A(wlmaxi, wl)] are generated from 8th-order template polynomials (Palacios et al., 1996; Hughes et al., 1998) using Dartnall nomogram translations along the wavelength axis to represent opsins of different peak wavelengths (Dartnall, 1953). C, Parameters for each of the i cone types are numbered in order from short to long wavelengths. SWS, short-wavelength-sensitive opsins; RH2, rhodopsin-like green-cone opsins; LWS, long-wavelength-sensitive opsins.

Expression Data

Expression Detail
Antibody Labeling
Phenotype Data

Phenotype Detail
Acknowledgments
This image is the copyrighted work of the attributed author or publisher, and ZFIN has permission only to display this image to its users. Additional permissions should be obtained from the applicable author or publisher of the image. Full text @ eNeuro