
- Title
-
A novel nanoluciferase transgenic reporter measures proteinuria in zebrafish
- Authors
- Naylor, R.W., Lemarie, E., Jackson-Crawford, A., Davenport, J.B., Mironov, A., Lowe, M., Lennon, R.
- Source
- Full text @ Kidney Int.

Figure 1. NL-D3 is uptaken by the megalin endocytosis pathway. (a) The top schematic shows binding affinity to megalin of the 3-dimensional domains of the receptor-associated protein (RAP). The bottom schematics show the size and orientation of full-length RAP bound to the N-terminus of Nano-Luc and the RAP D3 domain bound to the C-terminus of Nano-Luc (NL-D3, which was used in this work). (b) Sodium dodecylsulfate-polyacrylamide gel electrophoresis gel showing the recombinantly expressed and purified NL-D3 protein alongside molecular weight markers. (c) Graph showing the internalization of NL-D3 or untagged NL into MmR4 mini-megalin expressing cells and control nonmegalin expressing cells. ∗∗∗P ≤ 0.001. (d) Schematic for the γ-crystallin:mcherry/fabp10a:NL-D3 Tol2 vector used to generate transgenic zebrafish. (e) Panel showing the lateral view of a 5-day post-fertilization (dpf) NL-D3 transgenic zebrafish embryo under excitation for red fluorescence to highlight the mCh expression in the lens. Bar = 1 mm. (f) Histogram showing relative luminescence units (RLU) in whole embryo lysates of wild-type and NL-D3 5 dpf embryos. (g) Logarithmic histogram showing the RLU of 1 μl blood from adult wild-type and NL-D3 zebrafish. |
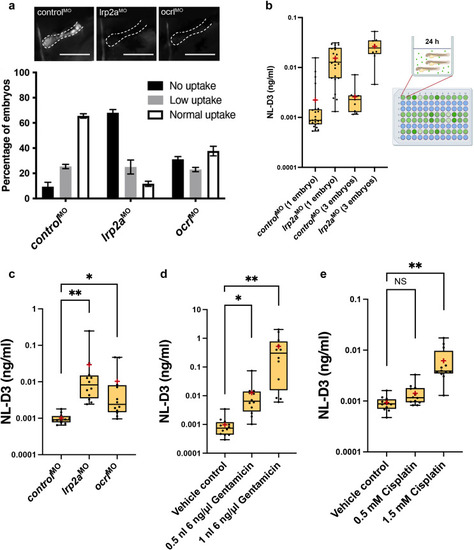
Figure 2. NL-D3 zebrafish can be used to assay proximal tubule dysfunction. (a) The top panels show close-up lateral views of pronephric proximal tubules after indicated treatments and 1–2 hours after dextran injection. Bar = 100 μm. The bar chart at the bottom shows the level of uptake of a 10 kDa fluorescent dextran in control (n = 40), lrp2a (n = 39), and ocrl (n = 42) morphant zebrafish embryos. (b) The box and whisker plot showing NL-D3 levels detected in controls and lrp2a morphants incubated as 1 embryo per well (n = 24) or 3 embryos per well (n = 9). The schematic showing the experimental setup for the NL-D3 zebrafish embryos; each 96-well plate was assessed for luminescence on a luminometer. (c) The box and whisker plot showing the amount of NL-D3 detected in the embryo medium in control (n = 12), lrp2a (n = 12), and ocrl (n = 12) morphants. (d) The box and whisker plot showing the amount of NL-D3 detected in the embryo medium in vehicle control (dimethylsulfoxide) and 2 volumes of injected gentamicin (n = 12 for each assay). (e) The box and whisker plot showing the amount of NL-D3 detected in the embryo medium in control and 2 concentrations of cisplatin (n = 12 for each assay). For box and whisker plots in (b)–(e), median is shown as a line and mean is shown as a red cross-hair. ∗P ≤ 0.05; ∗∗P ≤ 0.01. NS, not significant. PHENOTYPE:
|
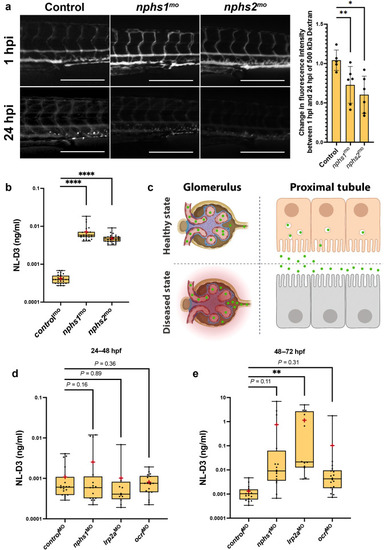
Figure 3. NL-D3 zebrafish can also be used to study glomerulopathies. (a) The panels show 4-day post-fertilization embryos injected with a 500 kDa fluorescein isothiocyanate–conjugated dextran at 1 hour post injection (hpi) and 24 hpi after the treatments shown (controlmo, n = 5; nphs1mo, n = 6; and nphs2mo, n = 6). Bar = 250 μm. The bar chart to the right shows the change in fluorescence intensity measured in the dextran-injected embryos at 24 hpi compared with 1 hpi. (b) Box and whisker plot showing the amount of NL-D3 detected in the embryo medium in control (n = 29), nphs1 (n = 28), and nphs2 (n = 22) morphant embryos. (c) Schematic highlighting the barrier function of the healthy state glomerular filter to NL-D3 and its reuptake in healthy state proximal tubules (top panels). The lowered barrier function in the glomerulus and the reduced endocytosis activity in the proximal tubules are displayed in the bottom panels, to schematically represent the dysfunction in these 2 tissues in a diseased state. (d,e) Box and whisker plots showing NL-D3 detected in the embryo medium taken from embryos treated as shown between 24–48 hours post fertilization (hpf) (d) and 48–72 hpf (e) (controlmo, n = 20; nphs1mo, n = 16; lrp2amo, n = 6; and ocrlmo, n = 18). In (b), (d), and (e), median is shown as a line and mean is shown as a red cross-hair. ∗P ≤ 0.05; ∗∗P ≤ 0.01; ∗∗∗∗P ≤ 0.001. |

Figure 4. Type IV collagens are expressed in the zebrafish glomerulus. (a) Schematic (created with Biorender) showing the 3 type IV collagen alpha chains expressed in the glomerular basement membrane (α3, α4, and α5) on the left, and their interaction to form the α4α4α5(IV) heterotrimer on the right. (b) In situ hybridizations showing the expression patterns of all 6 type IV collagen chains in zebrafish at 4 days post fertilization (dpf). The panels on the left are lateral views of the whole embryo (anterior left, Bar = 100 μm). The panels on the right are dorsal views of the head and anterior trunk region (anterior to the left, Bar = 50 μm). The inlet panels in the col4a1 and col4a3 whole embryo profiles show the glomerulus in the transverse section (Bar = 10 μm) through the point in the embryo highlighted in a red-dashed line on the whole embryo image. (c) Transverse sections through the glomerulus of 4 dpf zebrafish embryos immunostained for podocin (left panel) and pan-collagen IV (middle panel). The right panel shows schematic representation of the tissues in the cross-section at this position. DA, dorsal aorta; Glom, glomerulus; Not, notochord; PT, proximal tubule; Som, somite. To optimize viewing of this image, please see the online version of this article at www.kidney-international.org. EXPRESSION / LABELING:
|
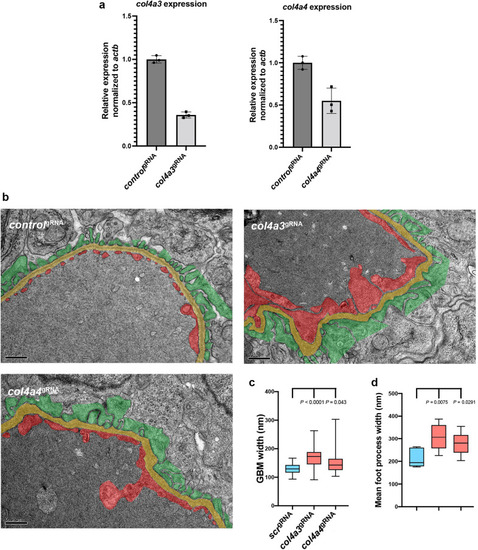
Figure 5. Depletion of col4a3 or col4a4 induces Alport syndrome phenotypes in zebrafish. (a) Bar charts showing real-time reverse transcription–polymerase chain reaction analysis of col4a3 and col4a4 in wild-type versus respective crispant embryos (n = 3). (b) Transmission electron microscopy images of the glomerular filtration barrier in control scr, col4a3, and col4a4 crispants (bar = 500 nm). Podocytes are pseudocolored green, the glomerular basement membrane (GBM) is yellow, and the endothelium is red. (c) Box and whisker plot showing the average GBM width in control scr, col4a3, and col4a4 crispants. (d) Box and whisker plot showing the average foot process width in control scr, col4a3, and col4a4 crispants. PHENOTYPE:
|
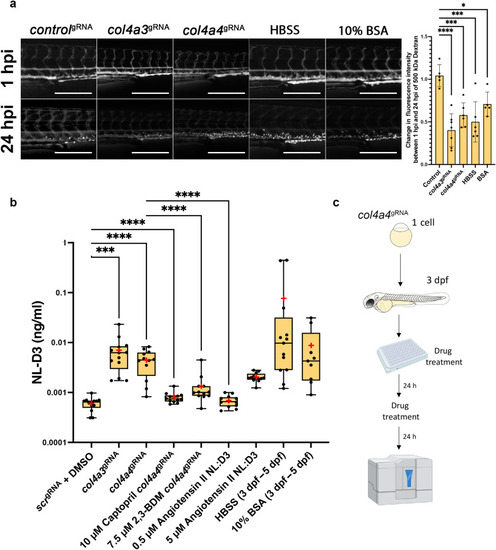
Figure 6. Alport zebrafish display proteinuria, which can be alleviated by reducing intraglomerular force. (a) The panels show 4-day post-fertilization (dpf) embryos injected with a 500 kDa fluorescein isothiocyanate–conjugated dextran at 1 hour post injection (hpi) and 24 hpi after the treatments shown (controlgRNA, n = 5; col4a3gRNA, n = 6; col4a4gRNA, n = 6; Hanks’ balanced salt solution [HBSS], n = 5; 10% bovine serum albumin [BSA], n = 5). Bar = 250 μm. The bar chart to the right shows the change in fluorescence intensity measured in the dextran-injected embryos at 24 hpi compared with 1 hpi. (b) Box and whisker plot showing the amounts of NL-D3 produced into the embryo medium in control scr (n = 13), col4a3 (n = 13), and col4a4 (n = 14) crispants. The effect of the angiotensin converting enzyme inhibiton captopril (n = 12) and 2,3-butanedione 2-monoxime (2,3-BDM, n = 12) on proteinuria in col4a4 crispants is also shown. Angiotensin II (n = 12), HBSS (n = 12), and 10% BSA (n = 9) all increased proteinuria in NL-D3 zebrafish embryos. Median is shown as a line and mean is shown as a red cross-hair. (c) Schematic showing the experimental pipeline for assaying the effects of chemicals in zebrafish NL-D3 embryos. DMSO, dimethylsulfoxide. ∗P ≤ 0.05; ∗∗∗P ≤ 0.01; ∗∗∗∗P ≤ 0.001. PHENOTYPE:
|