
Fig. 6
- ID
- ZDB-FIG-220927-91
- Publication
- Naylor et al., 2022 - A novel nanoluciferase transgenic reporter measures proteinuria in zebrafish
- Other Figures
- All Figure Page
- Back to All Figure Page
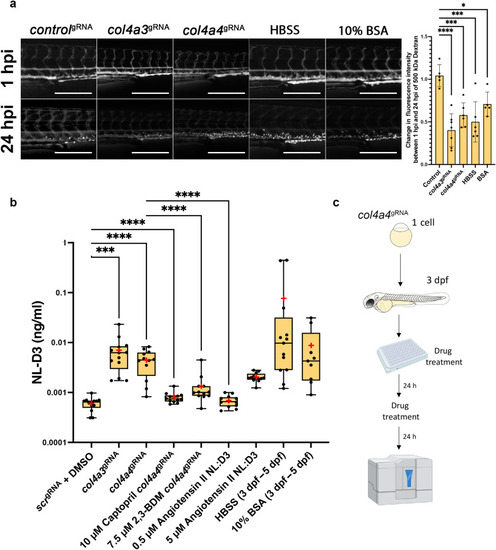
Figure 6. Alport zebrafish display proteinuria, which can be alleviated by reducing intraglomerular force. (a) The panels show 4-day post-fertilization (dpf) embryos injected with a 500 kDa fluorescein isothiocyanate–conjugated dextran at 1 hour post injection (hpi) and 24 hpi after the treatments shown (controlgRNA, n = 5; col4a3gRNA, n = 6; col4a4gRNA, n = 6; Hanks’ balanced salt solution [HBSS], n = 5; 10% bovine serum albumin [BSA], n = 5). Bar = 250 μm. The bar chart to the right shows the change in fluorescence intensity measured in the dextran-injected embryos at 24 hpi compared with 1 hpi. (b) Box and whisker plot showing the amounts of NL-D3 produced into the embryo medium in control scr (n = 13), col4a3 (n = 13), and col4a4 (n = 14) crispants. The effect of the angiotensin converting enzyme inhibiton captopril (n = 12) and 2,3-butanedione 2-monoxime (2,3-BDM, n = 12) on proteinuria in col4a4 crispants is also shown. Angiotensin II (n = 12), HBSS (n = 12), and 10% BSA (n = 9) all increased proteinuria in NL-D3 zebrafish embryos. Median is shown as a line and mean is shown as a red cross-hair. (c) Schematic showing the experimental pipeline for assaying the effects of chemicals in zebrafish NL-D3 embryos. DMSO, dimethylsulfoxide. ∗P ≤ 0.05; ∗∗∗P ≤ 0.01; ∗∗∗∗P ≤ 0.001. |