
- Title
-
N-methyl-N-nitrosourea induces zebrafish anomalous angiogenesis through Wnt/β-catenin pathway
- Authors
- Fu, S., Tan, R., Feng, Y., Yu, P., Mo, Y., Xiao, W., Wang, S., Zhang, J.
- Source
- Full text @ Ecotoxicol. Environ. Saf.
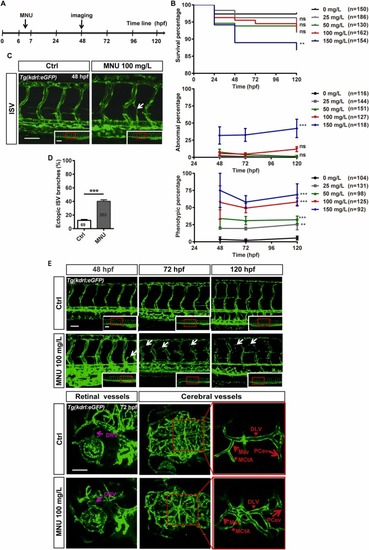
Fig. 1. The effects of MNU on angiogenesis of zebrafish. A. Research protocol. At 6 hpf (early gastrula period), Tg(kdrl:eGFP)s843 zebrafish embryos were treated with MNU solution for 1 h. Imaging analysis was performed after 48 hpf. MNU, N-methyl-N-nitrosourea. B. Different concentrations of MNU solution were used for embryos treatment at 6 hpf for 1 h. The survival rate (top), malformation rate (middle), and ectopic branching rate of blood vessels (bottom) were statistically analyzed at 24 hpf, 48 hpf, 72 hpf, 96 hpf and 120 hpf, respectively. Results for each concentration were obtained from three independent experiments. MNU of 0, 25, 50, 100 and 150 mg/L were displayed in black, gray, green, red, and blue, respectively. Data are shown as the mean ± SEM. * * P < 0.01 and * ** P < 0.001. C. Imaging analysis of the intersegmental blood vessel (ISV) ectopic budding phenotype in the control and 100 mg/L MNU treated groups. White arrows indicate ISV ectopic budding. ISV, intersegmental blood vessel. Scale bar, 50 µm. D. The percentage of embryos with ISV ectopic sprouting was calculated. Data are shown as the mean ± SEM. * ** P < 0.001. E. Representative images from control group and 100 mg/L MNU-treated groups at 48, 72 and 120 hpf (top), and representative images from brain and retinal vessels in 100 mg/L MNU treated groups at 72 hpf (bottom). Obvious ectopic vessels sprouts formed in the ISV (white arrows), brain and retina in 100 mg/L MNU treated groups. Red short arrows indicate the mesencephalic vein (MSV). Red asterisks indicate the middle cerebral artery (MCtA). Red arrowheads indicate the dorsal longitudinal vein (DLV). Red long arrows indicate the posterior cerebral vein (PCev) and purple arrows indicate the dorsal retinal vessel (DRV). Scale bars, 100 µm. |
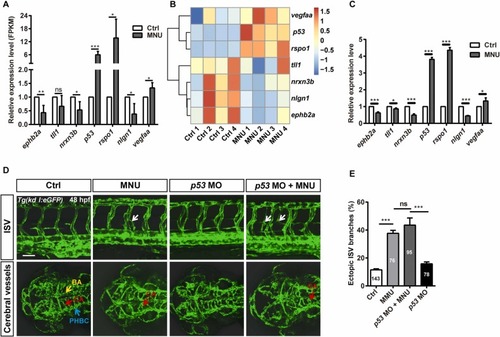
Fig. 2. The expression levels of angiogenesis-related genes were detected in zebrafish after MNU treatment. A. Transcriptome sequencing analysis of the expression levels of MNU-induced angiogenesis-related genes in zebrafish embryos. Genes significantly upregulated are shown in red, while genes that are significantly downregulated are shown in blue in heat map. Data are shown as the mean ± SEM. * P < 0.05, * * P < 0.01 and * ** P < 0.001. B. RT-qPCR data shows the expression levels of genes related to angiogenesis in normal embryos and MNU-treated embryos. Data are obtained from three independent experiments and shown as the mean ± SEM. * P < 0.05, * ** P < 0.01. C. Representative images of ISV and hindbrain vessels from control group, MNU-treated group, p53 MO-injected group and MNU-treated p53 MO group at 48 hpf. The hindbrain vessel images show the primary vessels, including primordial hind-brain channels (PHBC), basilar artery (BA), and central artery (CA). The blue arrow points to PHBC, the yellow arrow points to BA, and the red arrows point to CA. White arrows point to ectopic ISV branches. Scale bar, 50 µm. D. The percentage of ectopic ISV branches in control group, MNU-treated group, p53 MO-treated group and MNU-treated p53 MO group at 48 hpf. Data are obtained from three independent experiments. * ** P < 0.001. |
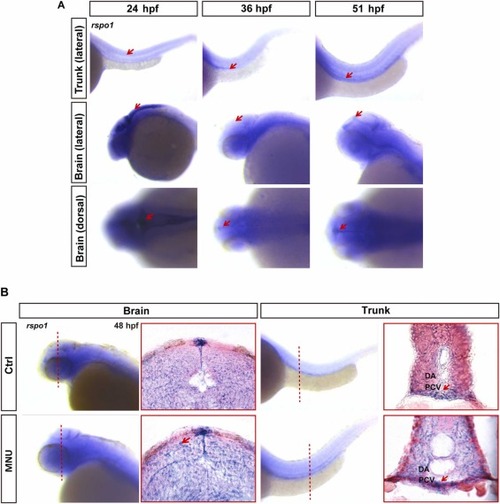
Fig. 3. rspo1 expression in embryo was detected in zebrafish treated with MNU. A. Whole-mount in situ hybridization of rspo1 in zebrafish embryos of wild type at 24 hpf, 36 hpf and 51 hpf respectively. Red arrows indicate regions with abundant rspo1 expression. B. Representative images of whole-mount in situ hybridization of rspo1 and frozen section analysis in the axial vessels of the DA and PCV of the control group and MNU-treated group at 48 hpf. Dotted line indicates the cross section site. Red arrows point to regions with abundant rspo1 expression. DA, dorsal aorta; PCV, posterior main vein. |
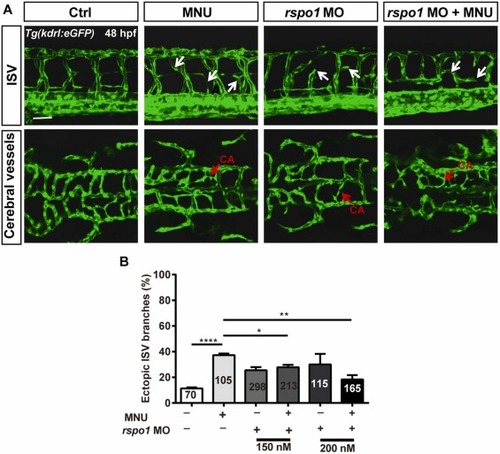
Fig. 4. Rspo1 is required for MNU-induced abnormal angiogenesis. A. Representative images of ISV and hindbrain vessels from control group, MNU-treated group, rspo1 MO-treated group and MNU-treated rspo1 MO group at 48 hpf. White arrows point to ectopic ISV branches. To better observe the phenotype, the concentration of rspo1 MO used was 150 μM for imaging analysis. Red arrows indicate the central artery (CA). Scale bar, 50 µm. B. Quantitative analysis of ectopic intersegmental vessel (ISV) branches in control group, MNU-treated group, rspo1 MO-injected group and rspo1 MO plus MNU-treated group at 48 hpf. Data were obtained from three independent experiments and are expressed as the mean ± SEM. * ** * P < 0.0001, * * P < 0.01, * P < 0.05. PHENOTYPE:
|
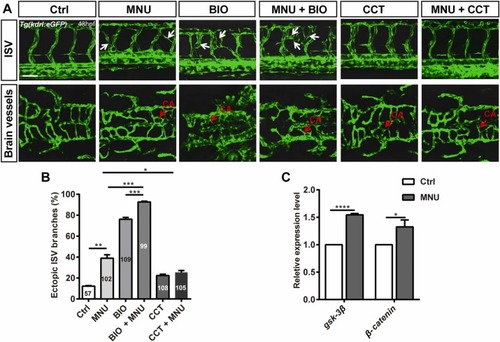
Fig. 5. Wnt/β-catenin signaling mediates MNU-induced abnormal angiogenesis. A. Representative images of ISV and hindbrain vessels from control group, MNU-treated group, BIO-treated group, BIO plus MNU-treated group, CCT-treated group and CCT plus MNU-treated group at 48 hpf. White arrows point to ectopic ISV branches. Red arrows point to the central artery (CA). BIO, (2'Z,3'E)− 6-bromoindirubin-3'-oxime; CCT, CCT036477. Scale bar, 50 µm. B. Quantitative analysis of ectopic intersegmental vessel (ISV) branches in control group, MNU-treated group, BIO-treated group, BIO plus MNU-treated group, CCT-treated group and CCT plus MNU-treated group at 48 hpf. Data were obtained from three independent experiments and are shown as the mean ± SEM. * **P < 0.001, * * P < 0.01, * P < 0.05. C. Quantitative analysis of gsk-3β and β-catenin expression of the control group and MNU-treated group by RT-qPCR. The data are presented as the mean ± SEM. * ** * P < 0.0001, * P < 0.05. |
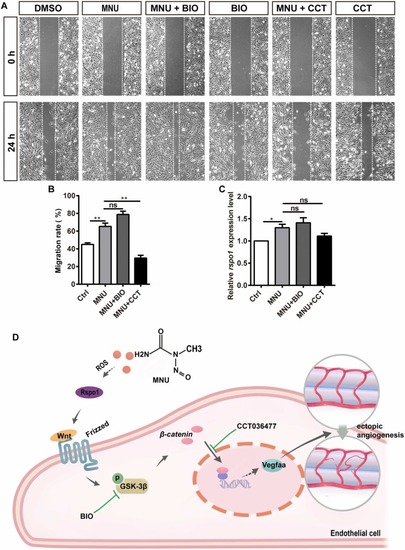
Fig. 6. The effect of MNU on endothelial migration and the model of MNU on zebrafish angiogenesis. A. Representative images of wound healing assay of bEnd.3 cells from control group, MNU-treated group, BIO-treated group and BIO plus MNU-treated group, CCT-treated group, and CCT plus MNU-treated group at 24 h. B. Quantitative analysis of migration rate of the control group, MNU-treated group, BIO plus MNU-treated group and CCT plus MNU-treated group at 24 h. BIO, (2'Z,3'E)− 6-bromoindirubin-3'-oxime; CCT, CCT036477. Data are shown as the mean ± SEM. * * P < 0.01. C. Quantitative analysis of rspo1 expression in the control group, MNU-treated group, BIO plus MNU-treated group and CCT plus MNU-treated group by qPCR. Data are shown as the mean ± SEM. * P < 0.05. D. Schematic model of MNU in promoting embryonic angiogenesis. |