
- Title
-
Rod genesis driven by mafba in an nrl knockout zebrafish model with altered photoreceptor composition and progressive retinal degeneration
- Authors
- Liu, F., Qin, Y., Huang, Y., Gao, P., Li, J., Yu, S., Jia, D., Chen, X., Lv, Y., Tu, J., Sun, K., Han, Y., Reilly, J., Shu, X., Lu, Q., Tang, Z., Xu, C., Luo, D., Liu, M.
- Source
- Full text @ PLoS Genet.
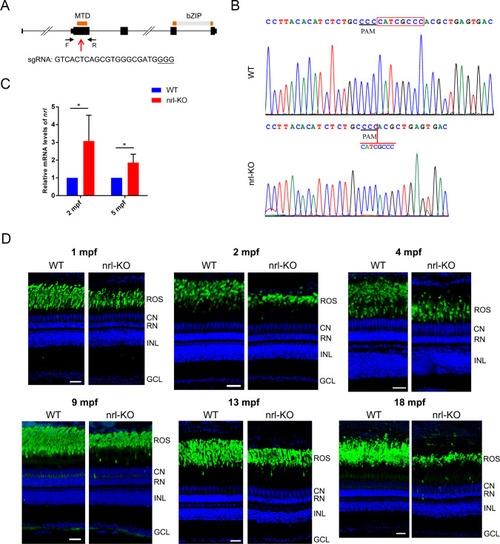
(A) The gene structure of zebrafish EXPRESSION / LABELING:
PHENOTYPE:
|
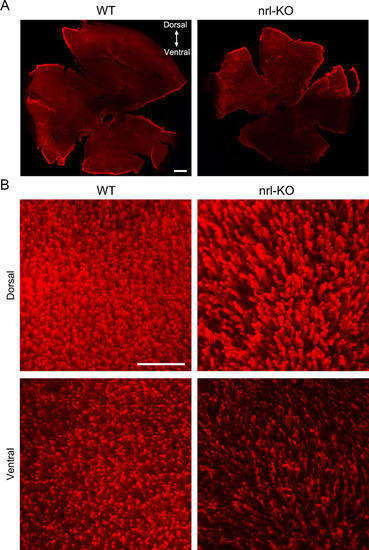
(A) The rod outer segments were visualized via immunostaining on the flattened whole-mount retinas from WT and PHENOTYPE:
|
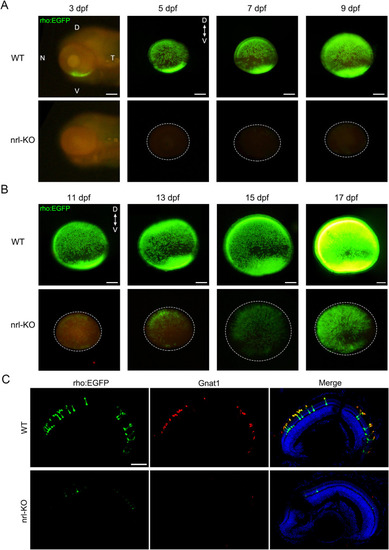
Rods were labeled with EGFP by crossing the WT or nrl-KO zebrafish with the Tg(rho:EGFP) transgenic line. Fluorescence was observed every 2 days from 3 dpf. Representative images of WT and nrl-KO retinas are shown in (A) for 3–9 dpf and (B) for 11–17 dpf. The dotted circles indicate the boundaries of the retinas. D, dorsal; V, ventral; N, nasal; T, temporal. Scale bars: 100 μm. (C) Immunostaining of retinal sections for Gnat1 (the rod transducin alpha-subunit) showed exact co-localization with EGFP in rods at 7 dpf. Rods were barely observed in the nrl-KO retinas. Scale bar: 50 μm. EXPRESSION / LABELING:
PHENOTYPE:
|
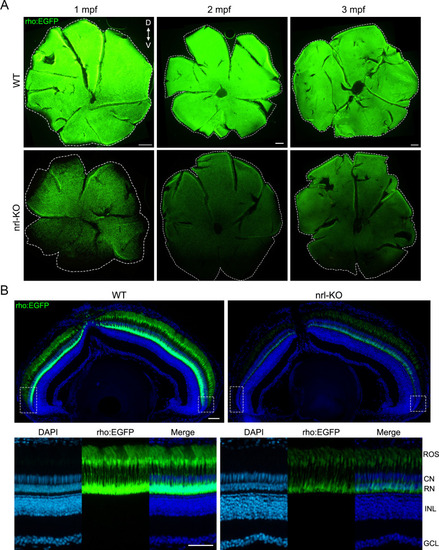
(A) The Tg(rho:EGFP) transgenic line was used to label rods with EGFP. Representative images of flattened whole-mount retinas from WT and EXPRESSION / LABELING:
PHENOTYPE:
|

(A) The volcano plot shows the 386 differentially expressed genes (196 up-regulated and 190 down-regulated) between WT and |
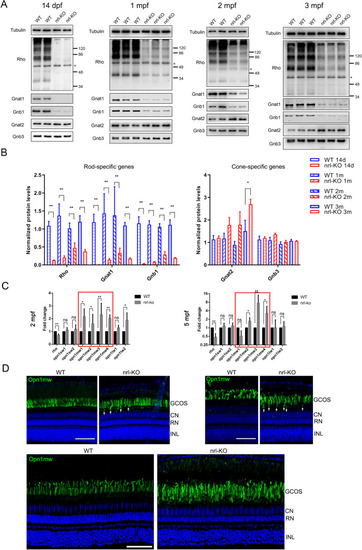
(A) The protein levels of rod-specific ( EXPRESSION / LABELING:
PHENOTYPE:
|
|
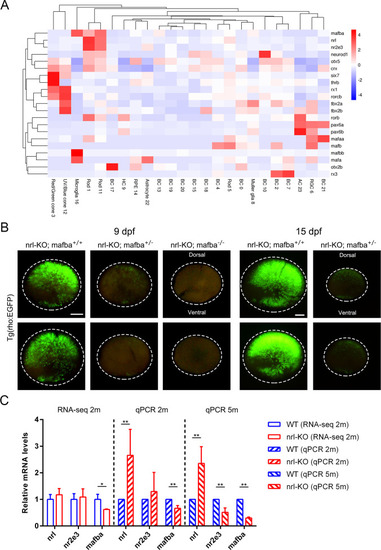
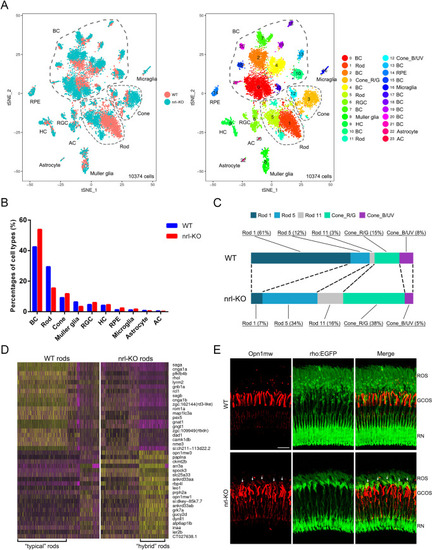
(A) Clustering analysis of the large MAF genes and the genes involved in photoreceptor development by using the expression data from scRNA-seq. The cell-type-specific expression pattern of |

The genes nearby |
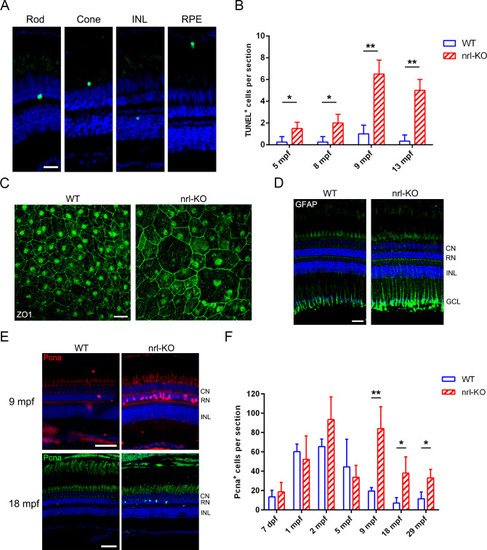
(A) The TUNEL assay results revealed that multiple types of retinal cells, including rods, cones, RPE, and inner retinal cells, undergo apoptosis in the |

There may be two types of rod precursors defined as |

Unillustrated author statements PHENOTYPE:
|