|
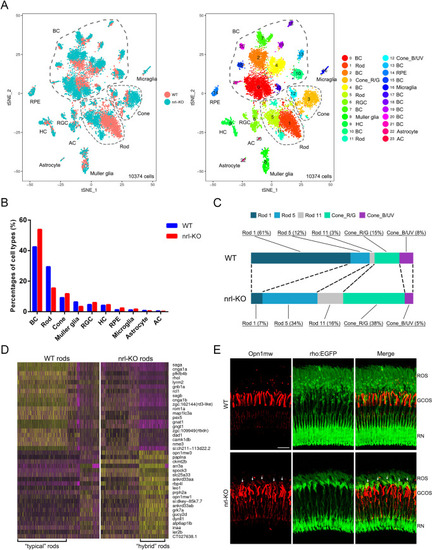
Single-cell RNA-seq analysis in WT and <italic toggle='yes'>nrl</italic>-KO retinas.(A) tSNE visualization of the unsupervised cell clusters from 5-month-old WT and nrl-KO zebrafish. Left, the distribution of cell clusters between the WT and nrl-KO groups. Right, the retinal cell types identified via scRNA-seq (see also S6 Fig). BC, bipolar cells; Cone_R/G, red and green cones; Cone_B/UV, UV and blue cones; RGC, retinal ganglion cells; HC, horizontal cells; AC, amacrine cells; RPE, retinal pigment epithelium. (B) Proportions of each retinal cell type in the WT and nrl-KO zebrafish. (C) The cell compositions and proportions of photoreceptor sub-clusters in WT and nrl-KO retinas. (D) The heatmap shows the clustering pattern of the top 20 down-regulated and top 20 up-regulated genes in the WT and nrl-KO rods. Yellow, high expression; purple, low expression. (E) Mis-expression of green-cone opsin in a proportion of rods in the nrl-KO retinas. The dorsal retinal regions of WT and nrl-KO zebrafish at 3 mpf are shown. Green, EGFP-labeled rods. Red, immunofluorescence signals of the anti-Opn1mw antibody. The green fluorescent signal in the nrl-KO group was artificially enhanced to discern the morphology of rods. ROS, outer segments of rods; GCOS, outer segments of green cones; RN, rod nuclear layer. Scale bar: 20 μm.
|