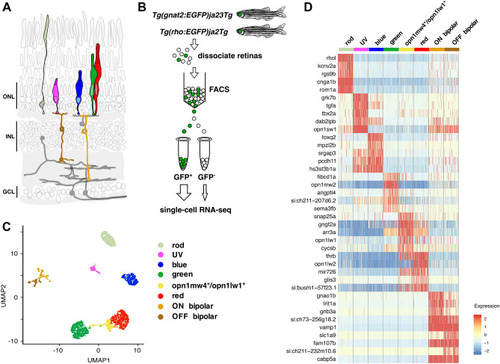
Transcriptome profiles of adult zebrafish photoreceptor subtypes. (A) Schematic representation of the major cell classes in the zebrafish retina based on a prior design7. Photoreceptor cell types and ON and OFF bipolar cells are highlighted in color, whereas other retinal cell types are in grey. The ON bipolar cell cluster in our single cell data expresses genes specific to both rod ON bipolar cells (prkcaa) and cone ON bipolar cells (gnao1b, gnb3a, trpm1a, rgs11, and isl1). See also Fig. S1. ONL outer nuclear layer, INL inner nuclear layer, GCL ganglion cell layer. (B) Isolation of rod and cone cells from transgenic adult zebrafish expressing green fluorescent protein (GFP). GFP-positive cells were collected from each line. A small percentage of GFP-negative cells was also included in the analysis. (C) Automatic clustering of single-cell expression profiles reveals six distinct photoreceptor populations. The plot shows a two-dimensional representation (UMAP) of global gene expression relationships among 2186 cells. (D) Heatmap showing top five differentially enriched genes for each cell population (rows). Columns correspond to single cells grouped by cell cluster. Each cell cluster is colored as in panel (C). Values are row-wise Z-scored gene-expression values. See also Fig. S1A. Full list of differentially enriched genes is provided in Supplementary Data S1.

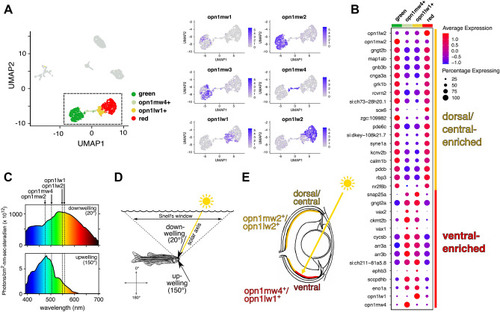
A distinctive subpopulation of red and green cones in the ventral retina. (A) Left: UMAP plot of cell clusters from Fig. 1C. Cell clusters except for green and red cones are colored gray. The opn1mw4+/opn1lw1+ cells were split into two sub-clusters (opn1mw4+ and opn1lw1+) based on the expression of opn1mw4+ and opn1lw1+. Right: Expression of green and red cone opsin genes within the cell populations enclosed by the dotted box in the UMAP plot. (B) Expression of the top 30 most differentially enriched genes (ranked by adjusted p-value) between ventral (opn1mw4+ and opn1lw1+) and dorsal/central (opn1mw1/2/3+ and opn1lw2+) green and red cones. Green and red cone clusters were identical to those in (A). Dot size reflects the percentage of cells within the cluster expressing the gene, and dot color indicates average expression level within the cluster. (CE) Ventrally localized opn1mw4+ and opn1lw1+ cones are positioned to detect downwelling light. (C) Intensity/spectral distributions for two lines of sight (downwelling light and upwelling light, 20° and 150° from vertical, respectively). These spectra were measured at a depth of 3 m in the lagoon of Enewetok (formerly Eniwetok) Atoll in the Marshall Islands. Data are reproduced from a previous study62. The maximum sensitivity of green and red opsin genes are indicated as dotted lines overlying the intensity/spectral distributions16. (D) From an underwater vantage point, all light from above the water surface enters via a circular aperture known as Snell’s window, which subtends an angle of ~ 96° relative to the fish’s eye irrespective of depth. Scattering and absorption by water cause the dominant wavelengths of transmitted light to vary with the direction of the line of sight. (E) The approximate location of the opn1mw4+ and opn1lw1+ cones is based on a prior in situ hybridization study17

Expression partitioning of paralogous phototransduction genes. (A) Schematic representation of vertebrate phototransduction cascade components. During phototransduction, light-activated opsin induces the detachment of the catalytic subunit Gα of the heterotrimeric G protein (transducin) from the inhibitory β/γ subunits. The activated Gα subunit then binds to the two inhibitory γ subunits of cGMP phosphodiesterase 6 (PDE6), thereby relieving inhibition on the catalytic subunits (α, β, and α′). The activated PDE subunits, in turn, catalyze the hydrolysis of the second messenger cGMP, leading to closure of cGMP-gated channels (CNG) on the plasma membrane and photoreceptor membrane hyperpolarization. Shut-off of the activated transducin is accelerated by a GTPase-activating protein complex (RGS9 and R9AP). The light-activated opsin is quenched via phosphorylation mediated by visual pigment kinases (GRK) and by the subsequent binding of arrestins. The activity of GRKs is regulated by binding of recoverin in a calcium-dependent manner. In the recovery/adaptation process, guanylyl cyclase activating protein (GCAP) enhances the synthesis of the second messenger cGMP through guanylyl cyclase (GC) in a calcium-dependent manner. Na+/Ca2+, K+ exchanger (NCKX) is involved in maintaining the dynamic equilibrium of calcium ions in the outer segment. In cones, the ion channel (CNG) and exchanger (NCKX) are located in the plasma membrane, whereas in rods they are located in the disc membrane. Figure design is adapted from Larhammar et al., 200980. (B) Phylogenetic tree showing the approximate time points at which various genome duplications occurred. (C) Evolutionary scenario for gene duplications of vertebrate phototransduction cascade genes (Left panels) and heatmap showing their expression levels in each cell population (Right panels). Left: The four dotted vertical lines mark the events, ‘1R’, ‘2R’, ‘II’, ‘III’, described in (B). The horizontal axis is not to scale. White circles indicate putative ancestral genes. Black circles indicate genes encoded in the zebrafish genome. Evolutionary branching patterns for each gene family are described according to the described previous studies8,45,47,48 and our BLAST searching results. Figure design is adapted from Lamb, 20208. Right: heatmap showing average expression levels of phototransduction genes in each cluster. Values are row-wise Z-scored gene-expression values. rcvrnb expression is not detected.

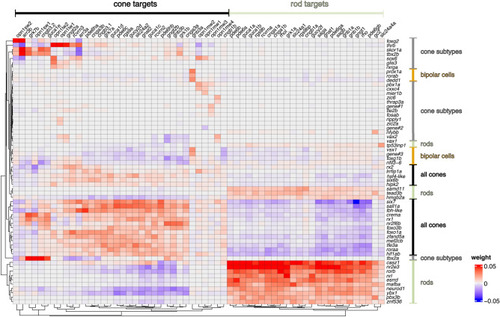
Candidate transcriptional regulators responsible for expression of phototransduction genes. Heatmap showing positive (red) and negative (blue) associations between transcriptional regulators (transcription factors and cofactors) and differentially expressed phototransduction genes (target genes) calculated by GENIE3 algorithm in SCENIC. Rows and columns are arranged according to divisive hierarchical clustering (dividing clusters in a top-down manner). The (dis)similarity of observations was calculated using Euclidean distances. Cell type expression patterns of the transcriptional regulators are presented in Fig. S5A. Gene#1: zgc:114046; Gene#2: zgc:110269; Gene#3: si:ch211–288g17.3.

ZFIN is incorporating published figure images and captions as part of an ongoing project. Figures from some publications have not yet been curated, or are not available for display because of copyright restrictions.

Acknowledgments
This image is the copyrighted work of the attributed author or publisher, and ZFIN has permission only to display this image to its users. Additional permissions should be obtained from the applicable author or publisher of the image. Full text @ Sci. Rep.