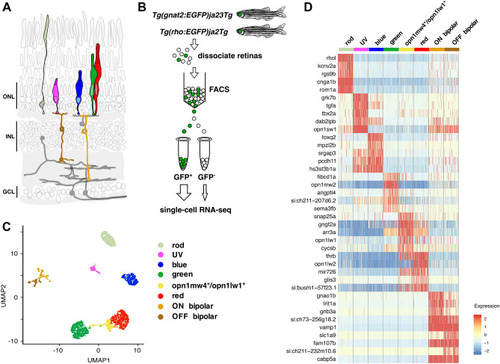
Transcriptome profiles of adult zebrafish photoreceptor subtypes. (A) Schematic representation of the major cell classes in the zebrafish retina based on a prior design7. Photoreceptor cell types and ON and OFF bipolar cells are highlighted in color, whereas other retinal cell types are in grey. The ON bipolar cell cluster in our single cell data expresses genes specific to both rod ON bipolar cells (prkcaa) and cone ON bipolar cells (gnao1b, gnb3a, trpm1a, rgs11, and isl1). See also Fig. S1. ONL outer nuclear layer, INL inner nuclear layer, GCL ganglion cell layer. (B) Isolation of rod and cone cells from transgenic adult zebrafish expressing green fluorescent protein (GFP). GFP-positive cells were collected from each line. A small percentage of GFP-negative cells was also included in the analysis. (C) Automatic clustering of single-cell expression profiles reveals six distinct photoreceptor populations. The plot shows a two-dimensional representation (UMAP) of global gene expression relationships among 2186 cells. (D) Heatmap showing top five differentially enriched genes for each cell population (rows). Columns correspond to single cells grouped by cell cluster. Each cell cluster is colored as in panel (C). Values are row-wise Z-scored gene-expression values. See also Fig. S1A. Full list of differentially enriched genes is provided in Supplementary Data S1.
|
