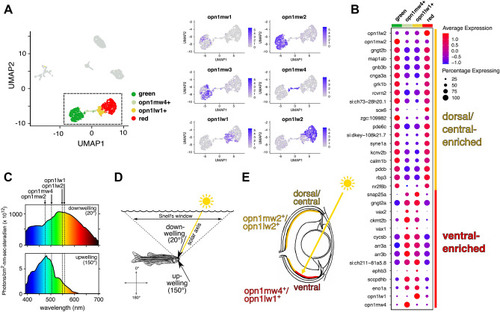
A distinctive subpopulation of red and green cones in the ventral retina. (A) Left: UMAP plot of cell clusters from Fig. 1C. Cell clusters except for green and red cones are colored gray. The opn1mw4+/opn1lw1+ cells were split into two sub-clusters (opn1mw4+ and opn1lw1+) based on the expression of opn1mw4+ and opn1lw1+. Right: Expression of green and red cone opsin genes within the cell populations enclosed by the dotted box in the UMAP plot. (B) Expression of the top 30 most differentially enriched genes (ranked by adjusted p-value) between ventral (opn1mw4+ and opn1lw1+) and dorsal/central (opn1mw1/2/3+ and opn1lw2+) green and red cones. Green and red cone clusters were identical to those in (A). Dot size reflects the percentage of cells within the cluster expressing the gene, and dot color indicates average expression level within the cluster. (C–E) Ventrally localized opn1mw4+ and opn1lw1+ cones are positioned to detect downwelling light. (C) Intensity/spectral distributions for two lines of sight (downwelling light and upwelling light, 20° and 150° from vertical, respectively). These spectra were measured at a depth of 3 m in the lagoon of Enewetok (formerly Eniwetok) Atoll in the Marshall Islands. Data are reproduced from a previous study62. The maximum sensitivity of green and red opsin genes are indicated as dotted lines overlying the intensity/spectral distributions16. (D) From an underwater vantage point, all light from above the water surface enters via a circular aperture known as Snell’s window, which subtends an angle of ~ 96° relative to the fish’s eye irrespective of depth. Scattering and absorption by water cause the dominant wavelengths of transmitted light to vary with the direction of the line of sight. (E) The approximate location of the opn1mw4+ and opn1lw1+ cones is based on a prior in situ hybridization study17
|
