
- Title
-
Zebrafish mutants provide insights into Apolipoprotein B functions during embryonic development and pathological conditions
- Authors
- Templehof, H., Moshe, N., Avraham-Davidi, I., Yaniv, K.
- Source
- Full text @ JCI Insight
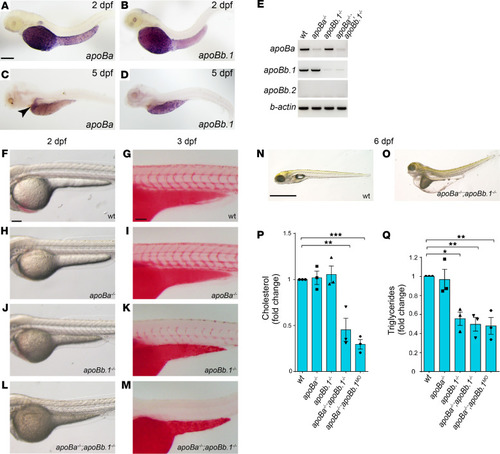
(A–D) Whole mount in situ hybridization (WISH) on 2 dpf zebrafish embryos showing strong expression of apoBa (A) and apoBb.1 (B) in the YSL (napoBa = 7; napoBb.1 = 6). At 5 dpf apoBa expression is enriched in the liver (C) and apoBb.1 in the YSL and the intestine (D) (napoBa=3; napoBb.1 = 3). (E) Semiquantitative PCR for the apoB genes in the different mutants. (F–M) Transmitted light images of 2 dpf embryos showing dark yolk in apoBb.1–/– (J) and apoBa–/– apoBb.1–/– (L) but not in WT (F) or apoBa–/– (H) mutant embryos. Three dpf embryos stained with Oil Red O (ORO) show decreased lipid levels in apoBb.1 mutant (K), as compared with WT (G) and apoBa–/– (I), embryos. (M) apoBa apoBb.1 double mutants display complete absence of lipids in circulation. (N and O) Transmitted light images at 6 dpf demonstrate severe malformations, unabsorbed yolk, and pronounced edema in apoBa apoBb.1 double mutants as compared with WT siblings. (P and Q) Cholesterol (P) and TG (Q) levels in the different apoB mutants compared with WT controls at 3 dpf. All measurements were carried out in deyolked embryos. n = 3, nembryos/sample = 20. The data are shown as the mean ± SEM, calculated using ANOVA followed by Tukey’s multiple-comparison test. Scale bar: (A–D; F–M) 100 μm, (N and O) 1 mm. *P < 0.05, **P < 0.01, ***P < 0.001. P < 0.05 (considered significant versus control group). |
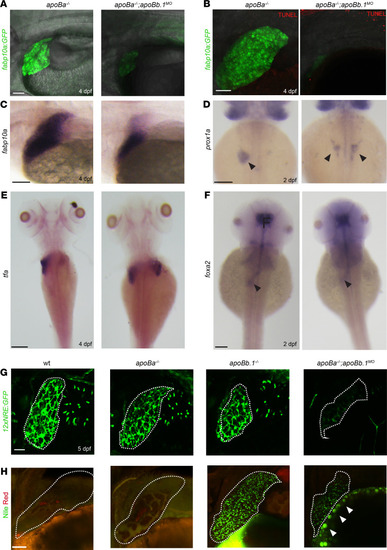
(A) Confocal images at 4 dpf of apoBa–/– and apoBa–/– apoBb.1MO embryos in Tg(-2.8fabp10a:EGFP)as3 background, showing smaller liver and decreased expression of fabp10a EGFP in apoBa–/– apoBb.1MO embryos (nWT = 8/8, napob–/– apoBa–/– apoBb.1MO = 7/7). (B) No apoptotic cells are detected in the liver of apoBa–/– or apoBa–/– apoBb.1MO embryos, following TUNEL staining (nWT = 6/6, napoBa–/– apoBb.1MO = 5/5). (C) WISH showing expression of fabp10a at 4 dpf, depicting decreased liver size in apoBa–/– apoBb.1MO embryos (nWT = 7, napoBa–/– apoBb.1MO = 13). (D and E) WISH with riboprobes against prox1a at 2 dpf (D) (nWT = 4/4, napoBa–/– apoBb.1MO = 7/9) and tfa at 4 dpf (E) (nWT = 7/7, napoBa–/– apoBb.1MO = 5/6) shows bilateral liver buds in apoBa–/– apoBb.1MO embryos as opposed to apoBa–/– mutants, which display a single liver bud located to the left of the midline. (F) Expression of forkhead box a2 (foxa2) at 2 dpf remains unchanged in apoBa–/– apoBb.1MO embryos as compared with apoBa–/– siblings. (G) Confocal images of 5 dpf Tg(12xNRE:Egfp) embryos with outlined livers, showing decreased Notch signal in the bile ducts of apoBa–/– apoBb.1MO embryos (nWT = 4, napoBa–/– = 8, napoBb1–/– = 6, napoBa–/– apoBb.1MO = 20). (H) Confocal images of Nile red staining at 4 dpf depicting neutral lipid accumulation in apoBb.1MO and apoBa–/– apoBb.1MO embryos. Red staining labels polar lipid; green fluorescence highlights neutral lipids (nWT = 5, napoBa–/– = 8, napoBb.1–/– = 5, napoBa–/– apoBb.1MO = 9). Scale bar: (A, B, G, and H) 50 μm, (C–F) 100 μm. |
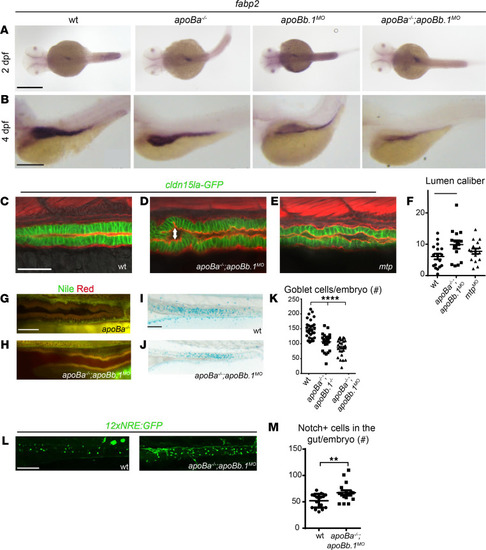
(A and B) WISH showing the spatial expression of fabp2 at 2 (A) and 4 (B) dpf. (C–E) Confocal images at 4 dpf of WT (C), apoBa–/– apoBb.1MO (D), and mtpMO (E) embryos in the TgBAC(cldn15la-GFP)pd1034 reporter background, stained with phalloidin (red). Enlarged lumen caliber (arrow) is detected in apoBa–/– apoBb.1MO and mtpMO embryos, as quantified (F) (n = 2, nWT = 17, napoBa–/– apoBb.1MO = 15, nmtpMO = 16). The data are shown as the mean ± SEM, calculated using ANOVA followed by Tukey’s multiple-comparison test. *P < 0.05. (G and H) Confocal images of the guts of 4 dpf apoBa–/– and apoBa–/– apoBb.1MO embryos stained with Nile red, show no lipid accumulation. (I and J) Bright-field images of 5 dpf embryos stained with Alcian blue showing reduced number of goblet cells in apoBa–/– apoBb.1–/– double mutants (J) as compared with WT embryos (I), as quantified (K) (n = 3, nWT = 30, napoBa–/– apoBb.1–/– = 27, napoBa–/– apoBb.1MO = 27). The data are shown as the mean ± SEM, calculated using ANOVA followed by Tukey’s multiple-comparison test. ****P < 0.0001. (L) Confocal images at 5 dpf of WT and apoBa–/– apoBb.1MO embryos in the Tg(12xNRE:Egfp) reporter background. (M) Quantification of number of cells displaying active Notch signaling in the guts of WT and apoBa–/– apoBb.1MO embryos. The data are shown as the mean ± SEM, calculated using 2-tailed Student’s t test. Scale bar: (A–E, G, and H) 50 μm, (I, J, and L) 100 μm. **P < 0.01. P < 0.05 (considered significant versus control group). |

(A) Schematic representation of the zebrafish embryonic vasculature, with red square marking the subintestinal vessels (SIVs). (B–G) Confocal images at 3 dpf showing ectopic sprouts (arrowheads) arising in the SIVs of apoba–/– apoBb.1–/– double mutants (E), and apoba–/– apoBb.1MO (F) and stalactite (stl) mutants (G), but not in WT (B), apoBa–/– (C), or apoBb.1–/– (D) animals. (H and I) Quantification of the number (H) and length (I) of ectopic sprouts at 3 dpf. n = 3, nWT = 45, napoBa–/– = 55, napoBb.1–/– = 23, napoBa–/– apoBb.1–/– = 31, napoBa–/– apoBb.1MO = 40, napoBb.1–/– apoBaMO = 21. The data are shown as the mean ± SEM, calculated using ANOVA followed by Tukey’s multiple-comparison test. ****P < 0.0001, **P < 0.01. (J and K) Confocal images at 5 dpf of apoBa–/– and apoba–/– apoBb.1MO embryos in the Tg(12xNRE:Egfp) reporter background. White arrowheads in apoBa–/– apoBb.1MO embryos point to endothelial cells (ECs) with active Notch signaling, in ectopic sprouts that failed to retract. n = 2, napoBa–/– = 10, napoBa–/– apoBb.1MO = 12. (L and M) Alkaline phosphatase (AP) staining of the SIVs at 3 dpf, showing inhibition of ectopic sprouting following intravascular injection of DiI-LDL into apoBa–/– apoBb.1MO. (N) Quantification of number and length of ectopic sprouts following intravascular injection of DiI-LDL (n = 3, napoBa–/– = 57, napoBa–/–+LDL = 43, napoBa–/– apoBb.1MO = 67, napoBa–/– apoBb.1MO+LDL = 57). The data are shown as the mean ± SEM, calculated using ANOVA followed by Tukey’s multiple-comparison test. ****P < 0.0001, ***P < 0.001. (O) AP staining of the SIVs of 3 dpf apoBa–/– apoBb.1MO embryos treated with OA, as quantified (P) (n = 3, napoBa–/– apoBb.1MO = 20, napoBa–/– apoBb.1MO+6μg OA = 19, napoBa–/– apoBb.1MO+10μg OA = 21, napoBa–/– apoBb.1MO+20μg OA = 22). The data are shown as the mean ± SEM, calculated using ANOVA followed by Tukey’s multiple-comparison test. Scale bar: (B–G) 50 μm, (J–O) 100 μm. P < 0.05 (considered significant versus control group). EXPRESSION / LABELING:
PHENOTYPE:
|
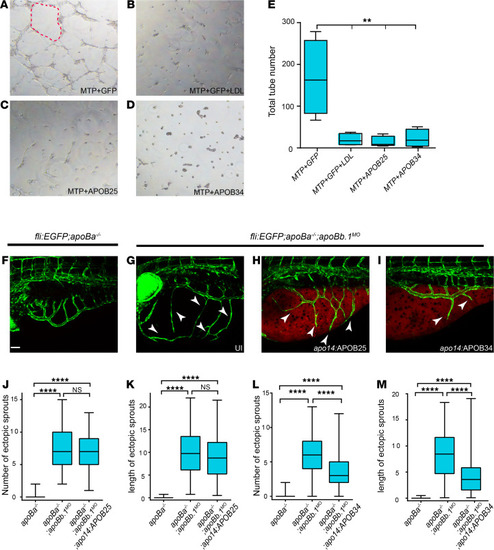
(A–D) Tube formation assay on HUVECs untreated (A, C, and D) or treated with LDL (B) plus conditioned medium from HEK293 cells cotransfected with (A and B) MTP+GFP, (C) MTP+APOB25, and (D) MTP+APOB34. Red dashed line outlines vascular tube structure. (E) Quantification of total number of tubes following different treatments (n = 3, nMTP+GFP = 4, nMTP+GFP+LDL = 4, nMTP+APOB25 = 5, nMTP+APOB34 = 4). The data are shown as the mean ± SEM, calculated using ANOVA followed by Tukey’s multiple-comparison test. **P < 0.01. (F–I) Confocal images at 4 dpf showing reduction in the number and length of ectopic sprouts in Tg(fli1:EGFP) apoBa–/– apoBb.1MO embryos injected with apo14:APOB34 (I) as compared with uninjected apoBa–/– (F), uninjected apoBa–/– apoBb.1MO (G), and apoBa–/– apoBb.1MO injected with apo14:APOB25 (H). White arrowheads point to ectopic sprouts. (J–M) Quantification of the number and length of ectopic sprouts in apo14 APOB25 (J and K) (n = 3, napoBa–/– = 47, napoBa–/– apoBb.1MO = 54, napoBa–/– apoBb.1MO apo14:APOB34 = 54) and apo14 APOB34 (L and M) (n = 3, napoBa–/– = 47, napoBa–/– apoBb.1MO = 51, napoBa–/– apoBb.1MO apo14:APOB34 = 55) injected embryos. The data are shown as the mean ± SEM, calculated using ANOVA followed by Tukey’s multiple-comparison test. Scale bar (F–I): 50 μm. ****P < 0.0001. P < 0.05 (considered significant versus control group). |