
|
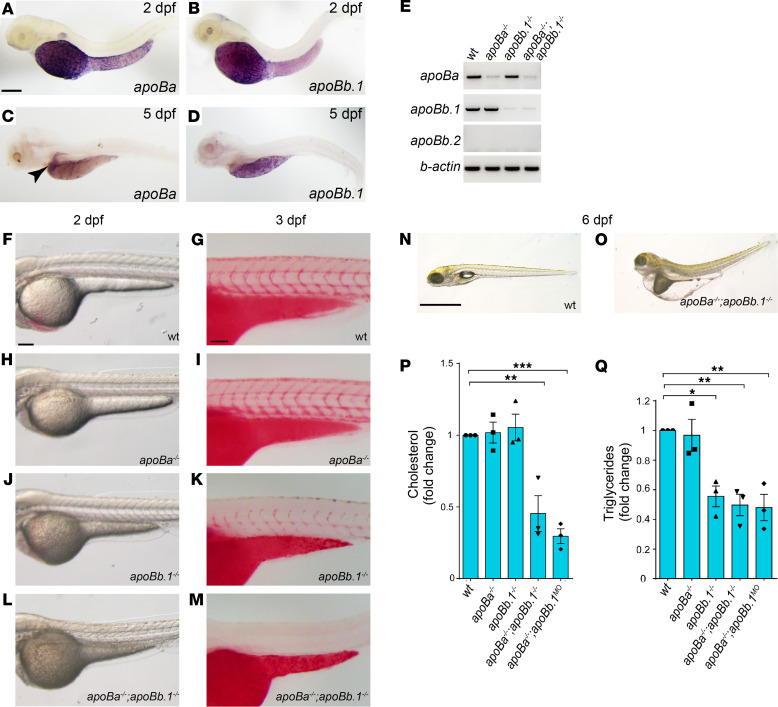
Figure 1 (A–D) Whole mount in situ hybridization (WISH) on 2 dpf zebrafish embryos showing strong expression of apoBa (A) and apoBb.1 (B) in the YSL (napoBa = 7; napoBb.1 = 6). At 5 dpf apoBa expression is enriched in the liver (C) and apoBb.1 in the YSL and the intestine (D) (napoBa=3; napoBb.1 = 3). (E) Semiquantitative PCR for the apoB genes in the different mutants. (F–M) Transmitted light images of 2 dpf embryos showing dark yolk in apoBb.1–/– (J) and apoBa–/– apoBb.1–/– (L) but not in WT (F) or apoBa–/– (H) mutant embryos. Three dpf embryos stained with Oil Red O (ORO) show decreased lipid levels in apoBb.1 mutant (K), as compared with WT (G) and apoBa–/– (I), embryos. (M) apoBa apoBb.1 double mutants display complete absence of lipids in circulation. (N and O) Transmitted light images at 6 dpf demonstrate severe malformations, unabsorbed yolk, and pronounced edema in apoBa apoBb.1 double mutants as compared with WT siblings. (P and Q) Cholesterol (P) and TG (Q) levels in the different apoB mutants compared with WT controls at 3 dpf. All measurements were carried out in deyolked embryos. n = 3, nembryos/sample = 20. The data are shown as the mean ± SEM, calculated using ANOVA followed by Tukey’s multiple-comparison test. Scale bar: (A–D; F–M) 100 μm, (N and O) 1 mm. *P < 0.05, **P < 0.01, ***P < 0.001. P < 0.05 (considered significant versus control group).