
|
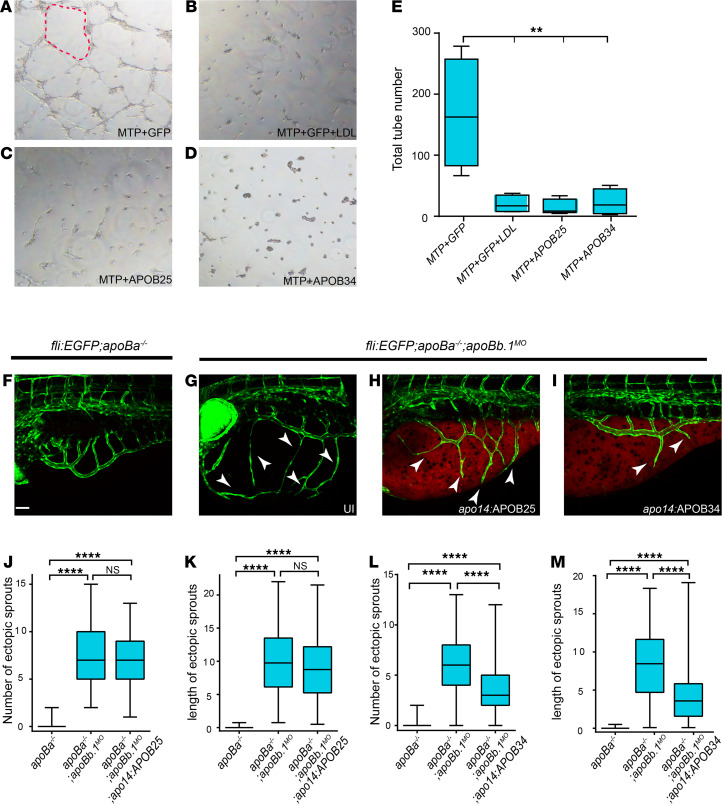
Figure 5 (A–D) Tube formation assay on HUVECs untreated (A, C, and D) or treated with LDL (B) plus conditioned medium from HEK293 cells cotransfected with (A and B) MTP+GFP, (C) MTP+APOB25, and (D) MTP+APOB34. Red dashed line outlines vascular tube structure. (E) Quantification of total number of tubes following different treatments (n = 3, nMTP+GFP = 4, nMTP+GFP+LDL = 4, nMTP+APOB25 = 5, nMTP+APOB34 = 4). The data are shown as the mean ± SEM, calculated using ANOVA followed by Tukey’s multiple-comparison test. **P < 0.01. (F–I) Confocal images at 4 dpf showing reduction in the number and length of ectopic sprouts in Tg(fli1:EGFP) apoBa–/– apoBb.1MO embryos injected with apo14:APOB34 (I) as compared with uninjected apoBa–/– (F), uninjected apoBa–/– apoBb.1MO (G), and apoBa–/– apoBb.1MO injected with apo14:APOB25 (H). White arrowheads point to ectopic sprouts. (J–M) Quantification of the number and length of ectopic sprouts in apo14 APOB25 (J and K) (n = 3, napoBa–/– = 47, napoBa–/– apoBb.1MO = 54, napoBa–/– apoBb.1MO apo14:APOB34 = 54) and apo14 APOB34 (L and M) (n = 3, napoBa–/– = 47, napoBa–/– apoBb.1MO = 51, napoBa–/– apoBb.1MO apo14:APOB34 = 55) injected embryos. The data are shown as the mean ± SEM, calculated using ANOVA followed by Tukey’s multiple-comparison test. Scale bar (F–I): 50 μm. ****P < 0.0001. P < 0.05 (considered significant versus control group).