
- Title
-
Single-cell transcriptome analysis reveals thyrocyte diversity in the zebrafish thyroid gland
- Authors
- Gillotay, P., Shankar, M., Haerlingen, B., Sema Elif, E., Pozo-Morales, M., Garteizgogeascoa, I., Reinhardt, S., Kränkel, A., Bläsche, J., Petzold, A., Ninov, N., Kesavan, G., Lange, C., Brand, M., Lefort, A., Libert, F., Detours, V., Costagliola, S., Singh, S.P.
- Source
- Full text @ EMBO Rep.
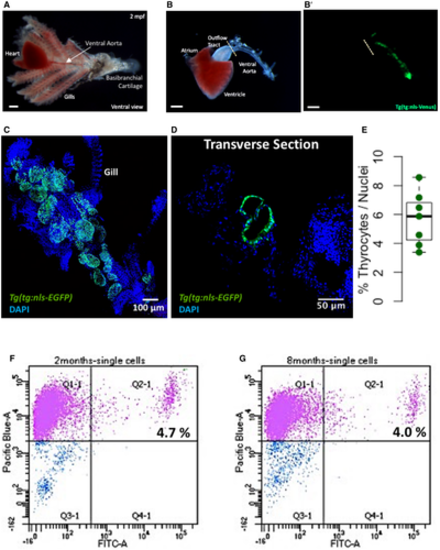
A, B. A brightfield image showing the zebrafish thyroid gland along with surrounding tissue. The thyroid follicles reside in the soft tissue surrounding the ventral aorta, which extends from the outflow tract of the heart into the gills toward the basibranchial cartilage in the lower jaw. The thyroid follicular cells, or thyrocytes, are labeled in green in the Tg(tg:nls-mVenus-NTR) transgenic line (B’). Scale bars: 500 µm. C. Maximum intensity projection of 3D confocal stack obtained from the dissected thyroid gland of Tg(tg:nls-EGFP) animal and labeled with DAPI. D. Confocal scan of a transverse section across the dissected thyroid gland from Tg(tg:nls-EGFP) animal at 3 mpf. Sections were stained with DAPI to visualize cells surrounding thyroid follicles. E. Boxplot depicting the proportion of thyrocytes present in transverse sections obtained from three Tg(tg:nls-EGFP) animals at 3 mpf. Each dot represents a transverse section. The Tukey boxplot marks the 25th percentile, median, and 75th percentile with whiskers extending from smallest to largest values. F, G. Representative FACS plot of single cells from Tg(tg:nls-mVenus-T2A-NTR) animals at 2 mpf (F) and 8 mpf (G). Calcein (Pacific Blue) labels live cells, while green fluorescence (FITC) labels thyrocytes. Percentage values represent proportion of calcein+ thyrocytes within total calcein+ cells. |
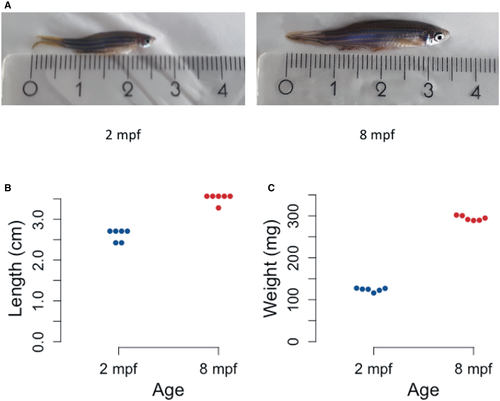
A. Representative images of zebrafish at 2 mpf (left) and 8 mpf (right). The ruler depicts length in cm. B. Dotplot representing the length of individual animals at each stage. Y-axis represents the length of six zebrafish from mouth to end of fin in cm. C. Dotplot representing the weight of individual animals at each stage. Y-axis represents the weight of six zebrafish in mg. |
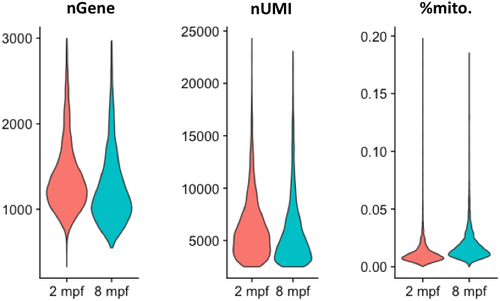
Violin plots depicting the number of genes (nGene), number of unique RNA molecules detected (nUMI—number of Unique Molecule Identifiers) and the percentage of reads mapped onto the mitochondrial genome for the cells profiled in the zebrafish thyroid gland atlas. |
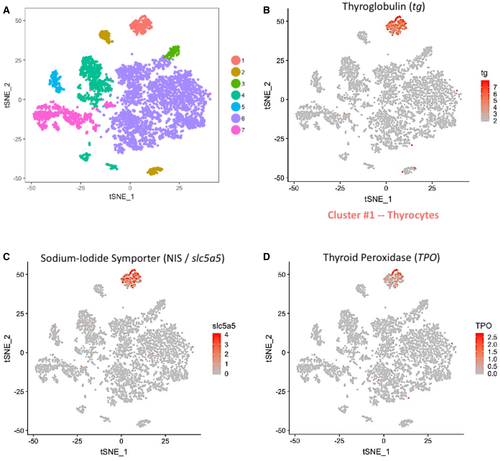
A. t-SNE plot displaying the 6,249 single cells profiled in the zebrafish thyroid gland atlas. The colors represent cell clusters denoting a specific cell type. B–D. Cluster #1 represents the thyrocytes that express tg, slc5a5 (NIS) and tpo. The color scale represents the normalized expression counts for each gene ranging from lowest (gray) to highest (red). |
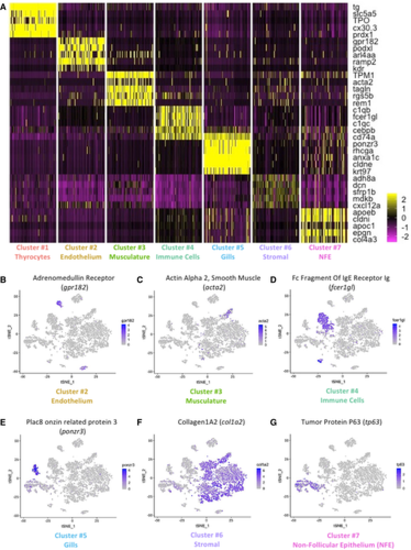
A. Heatmap depicting five genes specifically expressed in each one of the seven clusters of the zebrafish thyroid gland atlas. The color scale represents expression as a z-score ranging from −2 (purple) to 2 (yellow). NFE: Non-Follicular Epithelium. B–G. t-SNE plots overlaid with the expression of a gene specific to each of the cluster. The endothelium cluster (cluster #2) is a mix of blood vessels and lymphatic vessels (see Appendix Fig S4), while the immune cell cluster (cluster #4) is a mix of macrophages, neutrophils, and lymphocytes (see Appendix Fig S5). The color scale represents the normalized expression counts for each gene ranging from lowest (gray) to highest (blue). |
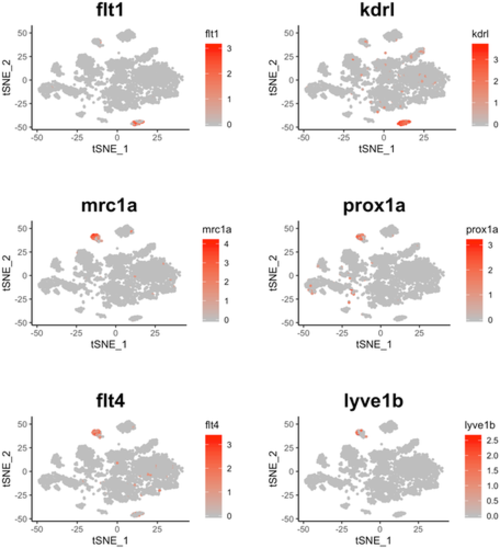
t-SNE plot overlaid with gene expression for genes specific to blood vessels (flt1 and kdrl) and lymphatic vessels (mrc1a, prox1a, flt4, and lyve1b). The color scale represents the normalized expression counts for each gene ranging from lowest (gray) to highest (red). |
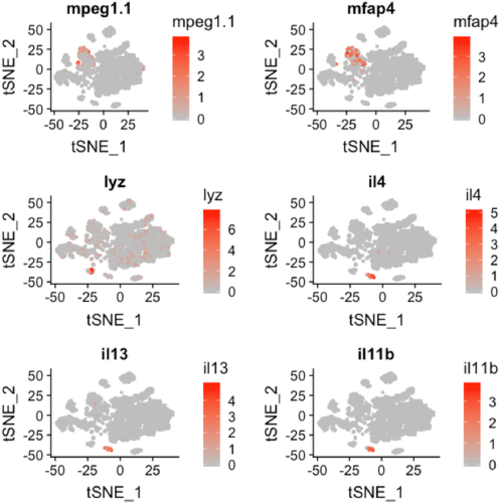
t-SNE plot overlaid with gene expression for genes specific to macrophages (mpeg1.1 and mfap4), neutrophils (lyz), and lymphocytes (il4, il13, and il11b). The color scale represents the normalized expression counts for each gene ranging from lowest (gray) to highest (red). |
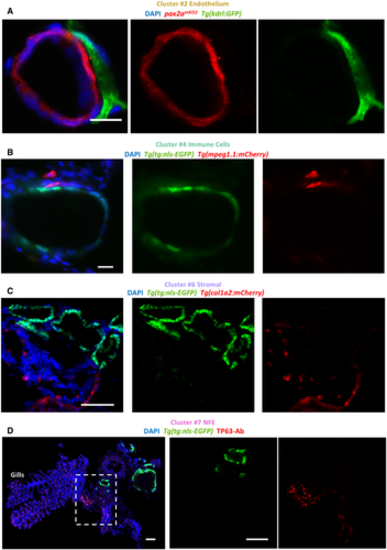
A–D. Images show immunofluorescence labeling of thyroid gland from adult zebrafish. Transverse sections were utilized for imaging. The organ was isolated from tissue-specific transgenic lines to allow marking of a particular cell type adjacent to the thyroid follicle. Blood vessels were marked using Tg(kdrl:EGFP) (A), macrophages using Tg(mpeg1.1:mCherry) (B), and stroma using Tg(col1a2:mCherry) (C). Thyrocytes were labeled with pax2amKO2 expression in (A) (described in Fig 7) and Tg(tg:nls-EGFP) expression in (B, C). (D) NFE was labeled using antibody against TP63 in sections of the thyroid gland isolated from Tg(tg:nls-EGFP) animals. Gills are marked based on their morphological appearance. DAPI labels nuclei. Scale bars: 10 µm (A, B), 50 µm (C, D). |
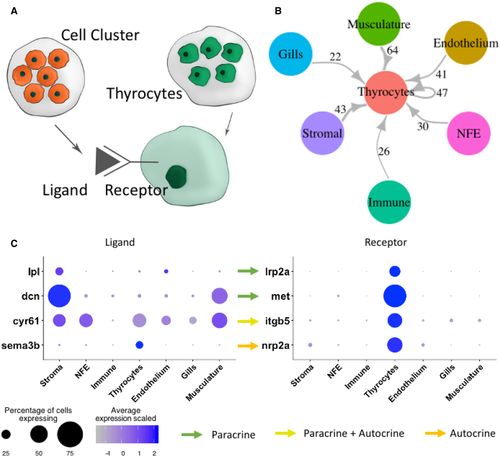
A. To build a connectome for the atlas, the ligands expressed specifically in each cell type were matched with their corresponding receptors in the thyrocytes. B. A highly connected intercellular interaction network is identified by the connectome. The number of ligand–receptor pairs identified between two cell types is denoted alongside the arrows. For NFE, Gills, and Stromal cells, the connectome was restricted to secreted ligands. C. A dotplot depicting examples of paracrine and autocrine signaling in the thyroid gland. The size of the dots represent percentage of cells expressing the gene in a particular cluster, while the color scale represents average expression of the gene in the cluster after scaling. |
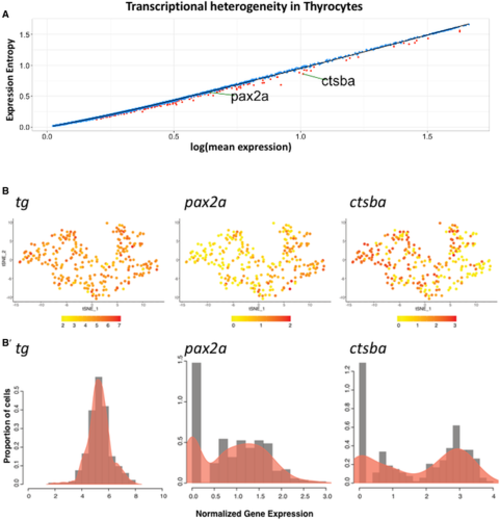
A. Dot plot depicting expression entropy on y-axis against average gene expression on x-axis for the thyrocyte population. Each dot depicts a gene, with red dots depicting genes that show statistically significant (P < 0.05) difference in entropy from expected value. Expected value is represented by black regression line. pax2a and ctsba are marked on the graph. B. t-SNE plot of the thyrocyte cluster with expression of tg,pax2a, and ctsba. The color scale represents the normalized expression counts for each gene ranging from lowest (yellow) to highest (red). B’ Histogram overlaid with density plots depicting the distribution of normalized gene expression for tg, pax2a, and ctsba. |
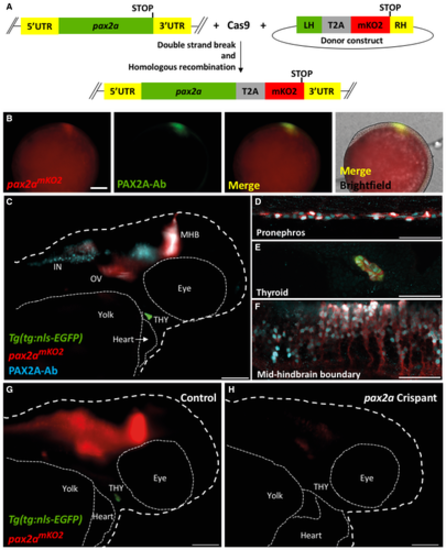
A. Schematic of the knock-in strategy used to generate the pax2amKO2 line. Double strand break was induced between the penultimate codon and the STOP codon of pax2a gene using CRISPR/Cas9. DNA repair integrates the donor construct at the site of double strand break, resulting in a pax2a reporter line. The donor construct contains T2A-mKO2 reporter cassette flanked by left homology (LH) and right homology (RH) arms. B. Whole mount immunofluorescence of 9.5hpf pax2amKO2 embryos stained with anti-mKO2 antibody (red) and anti-PAX2A antibody (green). Anterior is to the left, and dorsal side is to the top. Scale bar: 0.1 mm. C. Whole mount immunofluorescence of 55 hpf pax2amKO2; Tg(tg:nls-EGFP) stained with PAX2A antibody (PAX2A-Ab) displays an overlap of mKO2 and PAX2A-Ab signal. The otic vesicle (OV), mid-hindbrain barrier (MHB), interneurons (IN), and thyroid gland (THY) is labeled. White dashed line represents the outline of the zebrafish larvae. Scale bar: 100 µm. Anterior to the right. D–F. Confocal microscopy imaging of a sagittal section of a 55 hpf pax2amKO2 (red); Tg(tg:nls-EGFP) (green) embryos immunostained with PAX2A antibody (cyan) showing co-localization of mKO2 and pax2a in the pronephros (D), thyroid gland (E), and mid-hindbrain barrier (F). In the thyroid gland, mKO2 (red), PAX2A-Ab (cyan), and thyrocyte-specific GFP (green) show co-localization. Scale bar: 50 µm. G, H. Snapshots from live imaging of 55 hpf pax2amKO2; Tg(tg:nls-EGFP) embryos injected with sgRNA targeting pax2a coding sequence. The anterior part of a representative control embryo (G) is shown alongside a representative crispant (H). Crispants display a strong reduction of mKO2 fluorescence, as well as an absence of GFP signal suggesting absence of thyroid (THY) tissue. White dashed line represents the outline of the zebrafish larvae. Scale bar: 100 µm. Anterior to the right. |
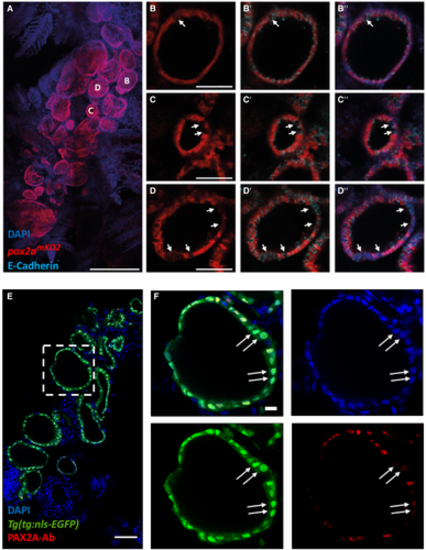
A–D. Analysis of 3 mpf thyroid gland from pax2amKO2 zebrafish shows heterogeneity in pax2a reporter expression. (A) Whole mount confocal imaging of a 3 mpf pax2amKO2 thyroid labeled with mKO2 (red), E-cadherin (cyan, not shown in "A" for clarity reasons) and DAPI (dark blue) for nuclear localization. (B–D) Optical sections of three follicles, with mKO2-Low cells labeled with arrows. E-cadherin (B’–D’) and DAPI (B’’–D’’) staining shows that absence of mKO2 signal does not correspond to an absence of cells. Anterior to the bottom of the pictures. E, F. (E) Confocal image of thyroid gland section from Tg(tg:nls-EGFP) at 4 mpf stained with PAX2A antibody and DAPI. The dotted region is displayed at high magnification in (F). Arrows marks thyrocytes displaying low PAX2A staining. Notably, PAX2A-Low thyrocytes display tg-driven EGFP expression, demonstrating their differentiated status. Data information: Scale bars: 250 µm (A), 50 µm (B–E), 10 µm (F). |
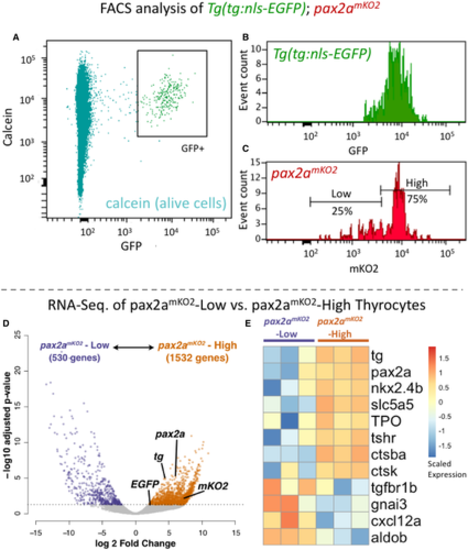
A–C. Cells from the thyroid gland of 5 mpf Tg(tg:nls-GFP); pax2amKO2 animals were labeled with calcein (live cell marker) and analyzed using FACS. (A) A FACS plot showing calcein on y-axis and GFP on x-axis. The box encompassing the GFP+ cells represents the thyrocyte population, which was gated for further analysis. (B) Histogram showing the distribution of GFP intensity in thyrocytes. (C) Histogram showing the distribution of mKO2 intensity in thyrocytes. Thyrocytes were selected by gating for GFP+ population. Horizontal lines indicate the mKO2-Low and mKO2-High expression level, with percentage values representing proportion of thyrocytes with mKO2-Low and mKO2-High expression. D, E. RNA-Seq analysis of transcriptome isolated from pax2amKO2-High and pax2amKO2-Low subpopulations. (D) Volcano plot representing the differential expression of genes between the two thyrocyte subpopulations. Dots for pax2a, tg, mKO2, and EGFP are marked. Dots for genes that display significant differential expression (DESeq2, adjusted P-value < 0.05) are colored. (E) Heatmap displaying the expression of selected genes in the two subpopulations. Biological replicates are represented by individual columns. |
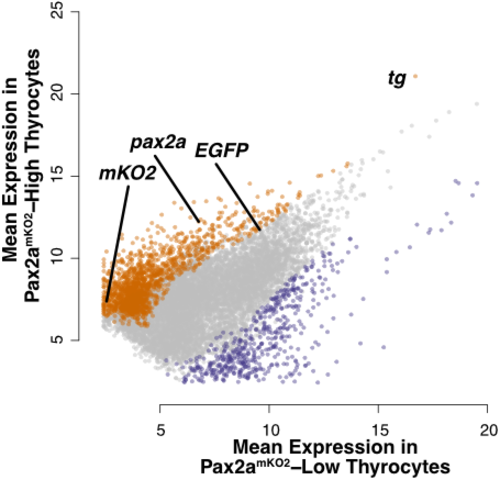
Dotplot depicting the mean expression of genes in pax2amKO2-High (y-axis) and pax2amKO2-Low (x-axis) subpopulations. Genes enriched in pax2amKO2-High and pax2amKO2-Low subpopulations are labeled in orange and violet, respectively. Dots representing pax2a, tg, mKO2, and EGFP are marked. |