
Fig. 7
- ID
- ZDB-FIG-211214-12
- Publication
- Gillotay et al., 2020 - Single-cell transcriptome analysis reveals thyrocyte diversity in the zebrafish thyroid gland
- Other Figures
- All Figure Page
- Back to All Figure Page
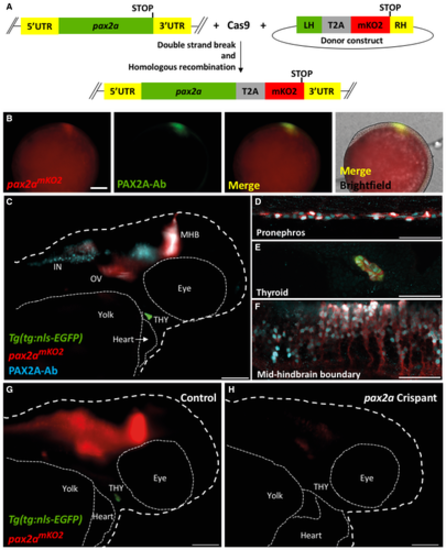
A. Schematic of the knock-in strategy used to generate the pax2amKO2 line. Double strand break was induced between the penultimate codon and the STOP codon of pax2a gene using CRISPR/Cas9. DNA repair integrates the donor construct at the site of double strand break, resulting in a pax2a reporter line. The donor construct contains T2A-mKO2 reporter cassette flanked by left homology (LH) and right homology (RH) arms. B. Whole mount immunofluorescence of 9.5hpf pax2amKO2 embryos stained with anti-mKO2 antibody (red) and anti-PAX2A antibody (green). Anterior is to the left, and dorsal side is to the top. Scale bar: 0.1 mm. C. Whole mount immunofluorescence of 55 hpf pax2amKO2; Tg(tg:nls-EGFP) stained with PAX2A antibody (PAX2A-Ab) displays an overlap of mKO2 and PAX2A-Ab signal. The otic vesicle (OV), mid-hindbrain barrier (MHB), interneurons (IN), and thyroid gland (THY) is labeled. White dashed line represents the outline of the zebrafish larvae. Scale bar: 100 µm. Anterior to the right. D–F. Confocal microscopy imaging of a sagittal section of a 55 hpf pax2amKO2 (red); Tg(tg:nls-EGFP) (green) embryos immunostained with PAX2A antibody (cyan) showing co-localization of mKO2 and pax2a in the pronephros (D), thyroid gland (E), and mid-hindbrain barrier (F). In the thyroid gland, mKO2 (red), PAX2A-Ab (cyan), and thyrocyte-specific GFP (green) show co-localization. Scale bar: 50 µm. G, H. Snapshots from live imaging of 55 hpf pax2amKO2; Tg(tg:nls-EGFP) embryos injected with sgRNA targeting pax2a coding sequence. The anterior part of a representative control embryo (G) is shown alongside a representative crispant (H). Crispants display a strong reduction of mKO2 fluorescence, as well as an absence of GFP signal suggesting absence of thyroid (THY) tissue. White dashed line represents the outline of the zebrafish larvae. Scale bar: 100 µm. Anterior to the right. |