
Fig. 8
- ID
- ZDB-FIG-211214-13
- Publication
- Gillotay et al., 2020 - Single-cell transcriptome analysis reveals thyrocyte diversity in the zebrafish thyroid gland
- Other Figures
- All Figure Page
- Back to All Figure Page
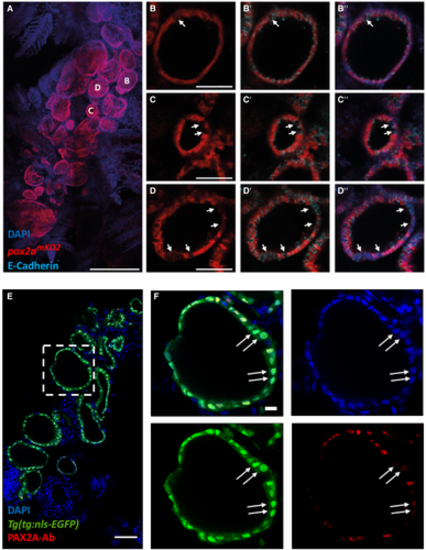
A–D. Analysis of 3 mpf thyroid gland from pax2amKO2 zebrafish shows heterogeneity in pax2a reporter expression. (A) Whole mount confocal imaging of a 3 mpf pax2amKO2 thyroid labeled with mKO2 (red), E-cadherin (cyan, not shown in "A" for clarity reasons) and DAPI (dark blue) for nuclear localization. (B–D) Optical sections of three follicles, with mKO2-Low cells labeled with arrows. E-cadherin (B’–D’) and DAPI (B’’–D’’) staining shows that absence of mKO2 signal does not correspond to an absence of cells. Anterior to the bottom of the pictures. E, F. (E) Confocal image of thyroid gland section from Tg(tg:nls-EGFP) at 4 mpf stained with PAX2A antibody and DAPI. The dotted region is displayed at high magnification in (F). Arrows marks thyrocytes displaying low PAX2A staining. Notably, PAX2A-Low thyrocytes display tg-driven EGFP expression, demonstrating their differentiated status. Data information: Scale bars: 250 µm (A), 50 µm (B–E), 10 µm (F). |