
|
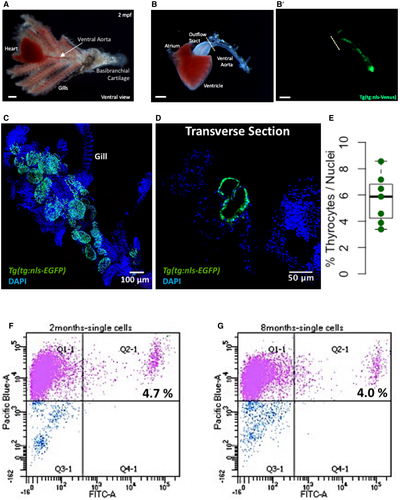
Fig. 1 A, B. A brightfield image showing the zebrafish thyroid gland along with surrounding tissue. The thyroid follicles reside in the soft tissue surrounding the ventral aorta, which extends from the outflow tract of the heart into the gills toward the basibranchial cartilage in the lower jaw. The thyroid follicular cells, or thyrocytes, are labeled in green in the Tg(tg:nls-mVenus-NTR) transgenic line (B’). Scale bars: 500 µm. C. Maximum intensity projection of 3D confocal stack obtained from the dissected thyroid gland of Tg(tg:nls-EGFP) animal and labeled with DAPI. D. Confocal scan of a transverse section across the dissected thyroid gland from Tg(tg:nls-EGFP) animal at 3 mpf. Sections were stained with DAPI to visualize cells surrounding thyroid follicles. E. Boxplot depicting the proportion of thyrocytes present in transverse sections obtained from three Tg(tg:nls-EGFP) animals at 3 mpf. Each dot represents a transverse section. The Tukey boxplot marks the 25th percentile, median, and 75th percentile with whiskers extending from smallest to largest values. F, G. Representative FACS plot of single cells from Tg(tg:nls-mVenus-T2A-NTR) animals at 2 mpf (F) and 8 mpf (G). Calcein (Pacific Blue) labels live cells, while green fluorescence (FITC) labels thyrocytes. Percentage values represent proportion of calcein+ thyrocytes within total calcein+ cells.