
|
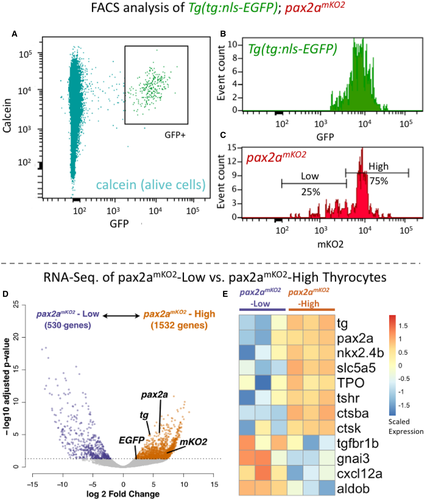
Fig. 9 A–C. Cells from the thyroid gland of 5 mpf Tg(tg:nls-GFP); pax2amKO2 animals were labeled with calcein (live cell marker) and analyzed using FACS. (A) A FACS plot showing calcein on y-axis and GFP on x-axis. The box encompassing the GFP+ cells represents the thyrocyte population, which was gated for further analysis. (B) Histogram showing the distribution of GFP intensity in thyrocytes. (C) Histogram showing the distribution of mKO2 intensity in thyrocytes. Thyrocytes were selected by gating for GFP+ population. Horizontal lines indicate the mKO2-Low and mKO2-High expression level, with percentage values representing proportion of thyrocytes with mKO2-Low and mKO2-High expression. D, E. RNA-Seq analysis of transcriptome isolated from pax2amKO2-High and pax2amKO2-Low subpopulations. (D) Volcano plot representing the differential expression of genes between the two thyrocyte subpopulations. Dots for pax2a, tg, mKO2, and EGFP are marked. Dots for genes that display significant differential expression (DESeq2, adjusted P-value < 0.05) are colored. (E) Heatmap displaying the expression of selected genes in the two subpopulations. Biological replicates are represented by individual columns.