
FIGURE
Fig. 9.5
- ID
- ZDB-FIG-211214-15
- Publication
- Gillotay et al., 2020 - Single-cell transcriptome analysis reveals thyrocyte diversity in the zebrafish thyroid gland
- Other Figures
- All Figure Page
- Back to All Figure Page
Fig. 9.5
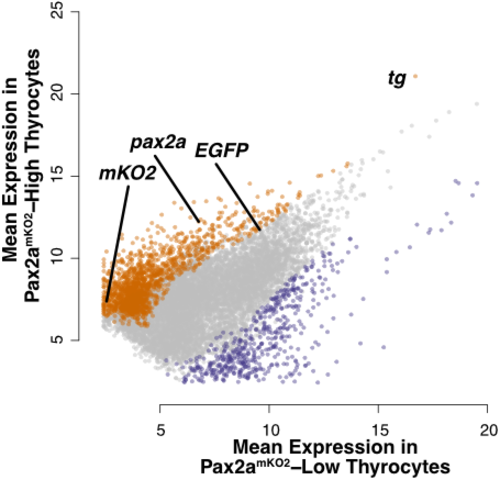
Dotplot depicting the mean expression of genes in pax2amKO2-High (y-axis) and pax2amKO2-Low (x-axis) subpopulations. Genes enriched in pax2amKO2-High and pax2amKO2-Low subpopulations are labeled in orange and violet, respectively. Dots representing pax2a, tg, mKO2, and EGFP are marked. |
Expression Data
Expression Detail
Antibody Labeling
Phenotype Data
Phenotype Detail
Acknowledgments
This image is the copyrighted work of the attributed author or publisher, and
ZFIN has permission only to display this image to its users.
Additional permissions should be obtained from the applicable author or publisher of the image.
Full text @ EMBO Rep.